
Jul 28th 2026
Resources
- Facebook Ads for Amazon [Video Course]
- Drive Traffic To Amazon [Ultimate Guide]
- Get More Amazon Reviews [Ultimate Guide]

TL;DR
Why can a healthy TACoS still hide serious problems?
Amazon’s Rufus AI assistant actively summarizes customer sentiment directly at the top of your listing. Because of this integration, early negative feedback or a lack of reviews can deter shoppers before they even scroll down to read your copy.
When can a high ACoS campaign still support profitable growth?
A high ACoS may be justified when a campaign attracts new customers, improves organic keyword rankings, or increases long-term sales. The key question is whether the spend creates growth beyond the directly attributed order.
How can sellers tell whether a new product launch is working?
Track click-through rate, conversion rate relative to the subcategory average, and movement in organic keyword rankings. During the first 30 to 45 days, these indicators matter more than immediate profitability.
How should sellers diagnose an underperforming Amazon campaign?
Start with visibility metrics such as Impression Share, then review efficiency metrics such as CTR, CVR, and CPC. Only after those appear healthy should you evaluate TACoS, Incremental ACoS, and Contribution Margin.
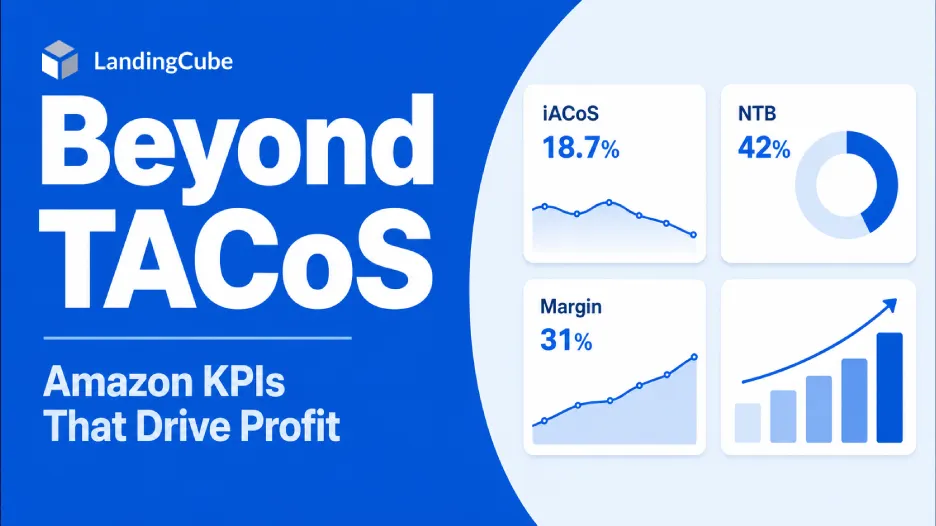
Amazon ad KPIs beyond TACoS include Incremental ACoS, New-to-Brand percentage, Impression Share, Contribution Margin, and Amazon Attribution data. Each one answers a question TACoS cannot, such as whether your ad spend is finding new customers, protecting your margin, or simply moving money around your account without adding any real growth.
Table of Contents
- Why TACoS Alone Can’t Tell You the Whole Story
- Match Your KPIs to Keyword Intent
- Match Your KPIs to Ad Format
- Visibility Metrics Most Sellers Track Too Late
- Incremental ACoS Shows You if Scaling Is Actually Working
- KPIs for a New Product Launch
- KPIs for Profit Optimization on Mature Products
- Build an Amazon Advertising KPI Dashboard That Ties It All Together
- The Bottom Line
- FAQ: All About Amazon Ad KPIs
TACoS only tells you the ratio between your ad spend and your total sales. It hides which keywords deserve your budget, whether your launch is on track, and whether scaling your spend is actually adding profit. This guide breaks down the Amazon ad KPIs beyond TACoS that fill those gaps, with real formulas and examples, and shows how LandingCube helps you track them all in one place.
Why TACoS Alone Can’t Tell You the Whole Story
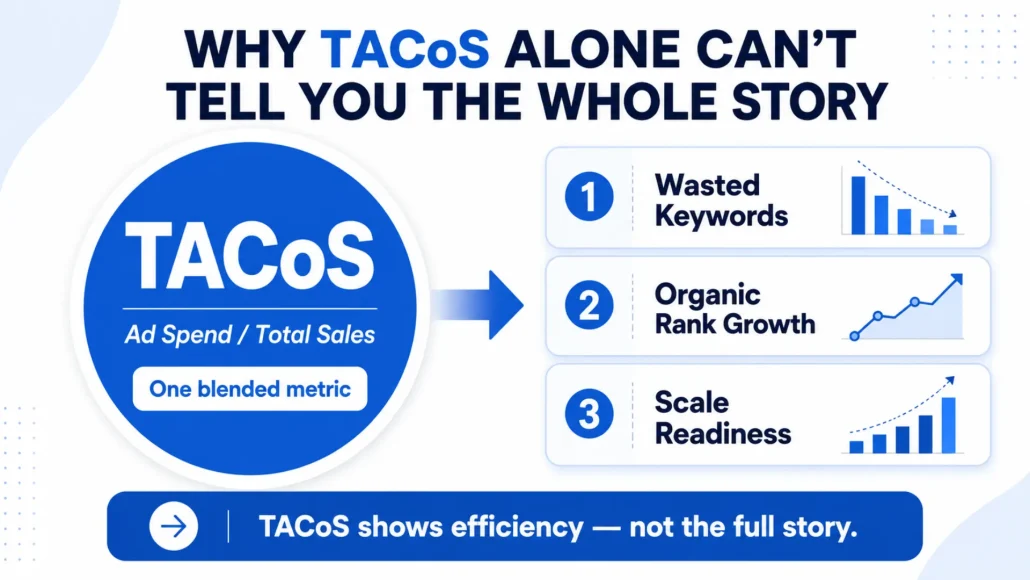
Understanding TACoS vs ACoS vs ROAS is step one, but it is only step one. TACoS measures your total ad spend against your total revenue and gives you a single, blended number for your whole account. That is exactly why it falls short when used on its own.
A blended number hides what is happening underneath it. It does not show you:
- Which keywords are wasting money
- Which ones are quietly building your organic rank
- Which products are actually ready to scale
If you force every campaign toward the same 10 or 15 percent target, you end up cutting bids on your highest-volume keywords simply because their individual ACoS looks bad. That chokes off the traffic Amazon’s ranking algorithm needs to hold your organic position, and your total sales drop as a result.
U.S. retail e-commerce sales reached $326.7 billion in the first quarter of 2026 alone, according to the U.S. Census Bureau, and Amazon accounts for a large share of that spend. With that much competition for the same shoppers, a single blended metric will not tell you where your next ad dollar should go.
You need Amazon ad KPIs beyond TACoS that match your keyword intent, your ad format, and your product’s stage in its life cycle.
Match Your KPIs to Keyword Intent
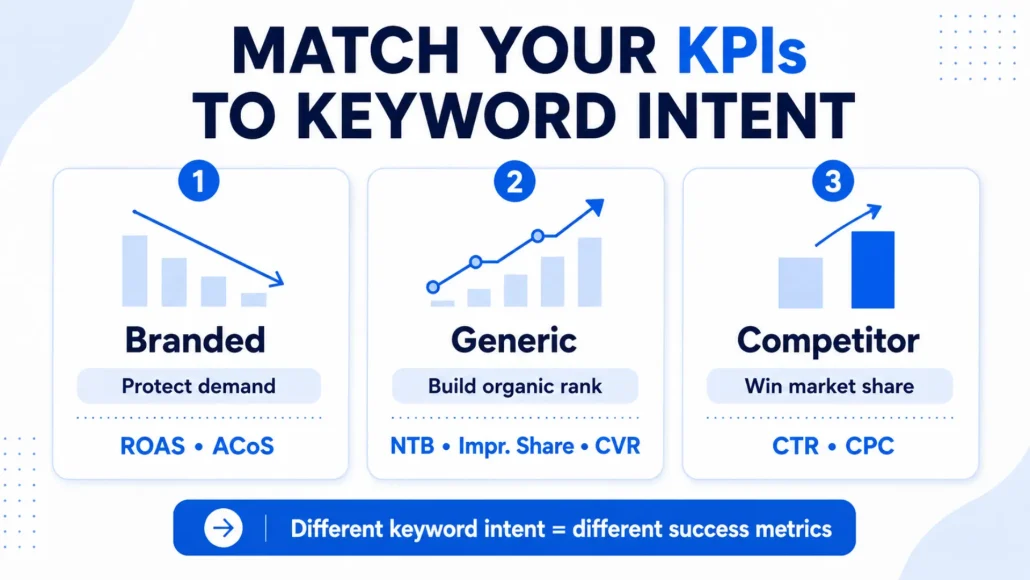
Not every keyword deserves the same target, because each one plays a different role in your Amazon marketing funnel. Judging a branded search the same way you judge a broad category term is like judging a first date the same way you judge a wedding anniversary:
Branded Keywords Protect What You Already Own
When a shopper searches your exact brand name, they already know you and are close to buying. Your job here is defense, not growth. Keep competitors from stealing that click, and do it as cheaply as possible.
For branded keywords, watch Return on Ad Spend (ROAS) and ACoS first. Conversion rates on these terms often run above 20 percent, so you should expect a very low ACoS, sometimes in the single digits.
Do not treat a 5 percent ACoS on branded terms as proof that your whole account is healthy. It is defensive spending, and it can hide problems everywhere else in your campaigns.
Generic and Category Keywords Fuel Organic Growth
Generic terms like “garlic press” or “running shoes for men” bring in shoppers who know what they want but have not picked a brand yet. If you judge these keywords by ACoS alone, you will pause them fast, since they are expensive and their direct return often looks weak.
But generic keywords are how you build organic rank. The KPIs that matter here are New-to-Brand (NTB) orders, Impression Share, and Conversion Rate (CVR). Advertisers who use the full set of Sponsored Brands ad formats see an average of 79 percent of their sales come from new-to-brand metrics, based on Amazon’s own reporting.
A 60 percent ACoS on a generic keyword can be a smart trade if it pushes your listing to page one organically, where you start collecting sales without paying for every click.
Competitor Targeting Steals Market Share
Bidding on a competitor’s ASIN or brand name is an aggressive move, and it usually converts lower than your own branded terms do. Your goal here is disruption, not efficiency.
Watch Click-Through Rate (CTR) and Cost Per Click (CPC) closely. These numbers tell you if your price and creative are strong enough to pull a shopper away from the product they originally meant to buy. You can accept a higher ACoS on competitor targeting in exchange for stealing market share and building awareness in your niche.
Match Your KPIs to Ad Format
RANK LIKE THE PROS
Discover a better way to rank products from external traffic, like Facebook, Google and TikTok, with LandingCube promo pages.
Try it free for 21 days.
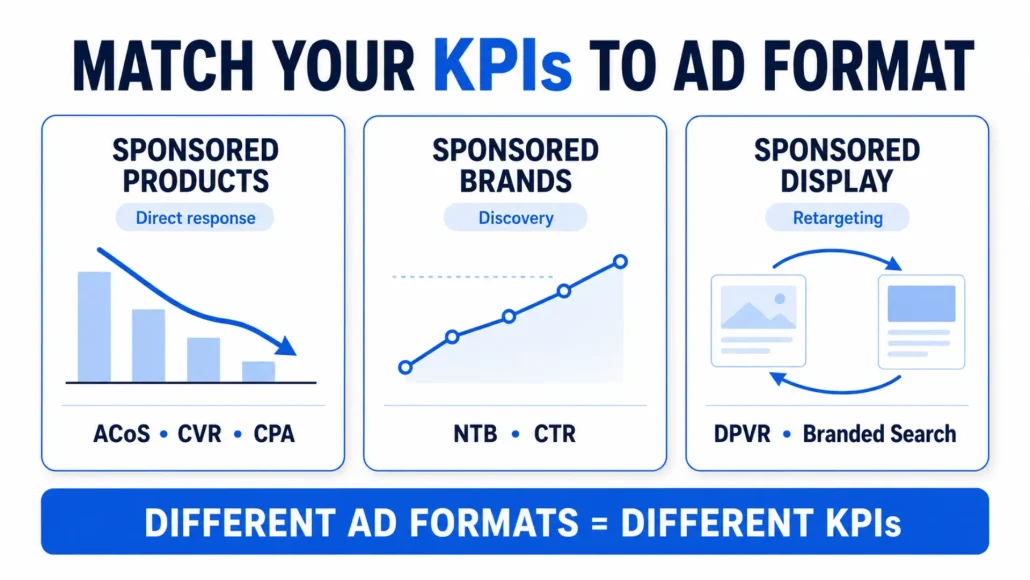
Keyword intent is not the only thing that should shape your KPIs. Before you can act on Amazon ads metrics beyond ACoS, you need to know which ad format you are actually looking at, since each one points to a different stage of the shopping journey:
Sponsored Products Ads Reward Direct Response Metrics
Sponsored Products makes up most of the ad spend for most sellers, because these ads blend into the organic search results and reach shoppers who are ready to click “Add to Cart.”
Watch your direct ACoS, Conversion Rate, and Cost Per Acquisition (CPA) closely here. If a Sponsored Products campaign is losing money without lifting your organic rank, the problem is usually your listing or your price, not your bid.
Run an Amazon listing audit before you touch your bids any further. A weak main image or unclear bullet points will sink even a perfectly bid campaign, and no amount of bid tweaking will fix that.
Sponsored Brands Ads Reward Discovery Metrics
Sponsored Brands ads, including headline search and video formats, sit at the top of the search results and introduce shoppers to your brand while they are still browsing. Judging these by immediate ACoS misses the point of why you are running them.
Track New-to-Brand percentage and Click-Through Rate instead. If a Sponsored Brands video campaign runs at a 45 percent ACoS but brings in a wave of new-to-brand customers, that is often a profitable long-term trade, as long as those customers come back to buy again.
Sponsored Display Ads Reward Retargeting Metrics
Sponsored Display retargets shoppers on and off Amazon, and it will almost never match Sponsored Products on raw ACoS. Expecting it to do so just means you shut off a touchpoint that is actually working in the background.
Watch Detail Page View Rate and any lift in branded search volume instead. These leading indicators show whether your display ads keep your product in a shopper’s mind long enough for them to come back and buy later.
Pairing Sponsored Display with how to drive external traffic to Amazon sources, such as Meta or Google, often produces a stronger combined effect than either channel running alone.
Visibility Metrics Most Sellers Track Too Late
Efficiency metrics tell you what already happened. Visibility metrics tell you where you stand right now, which is exactly why they deserve a place among your Amazon ad KPIs beyond TACoS:
Impression Share Shows You How Much of the Auction You’re Winning
Impression Share, sometimes called Share of Voice, is the percentage of available impressions your ads actually captured for a keyword compared to every other advertiser bidding on it.
Amazon’s own top-of-search impression share data shows advertisers lifting their branded keyword visibility from an average of 62.7 percent up to 99.3 percent when they secure dedicated placement.
If your Impression Share is low and you still have budget left over, that usually points to a relevance or listing quality issue rather than a bidding problem. If your budget is maxed out and your Impression Share is still low, you likely need to raise bids or accept that you are being outspent on that term for now.
Amazon Attribution Tracks What Happens Before the Amazon Click
If you send any traffic to Amazon from Google, Meta, or TikTok, Amazon Attribution is the only official way to see what that traffic actually did once it landed on your product page. It runs on a 14-day last-touch window and is free for brand-registered sellers. It tracks:
- Impressions and clicks
- Detail page views
- Add-to-carts and purchases
Pairing Attribution tags with an Amazon landing page adds a second layer of data, including email capture rates and pre-sale intent signals, that Attribution alone cannot show you.
Attribution data matters for your Amazon Ad KPIs beyond TACoS because it separates your off-Amazon efficiency from your on-Amazon efficiency. A campaign with a high click-to-detail-page rate but a low purchase rate points to a listing problem, not an ad problem.
Amazon also credits brands with a Brand Referral Bonus, which averages 10 percent of the sale price, for purchases driven through Attribution-tagged links.
Incremental ACoS Shows You if Scaling Is Actually Working
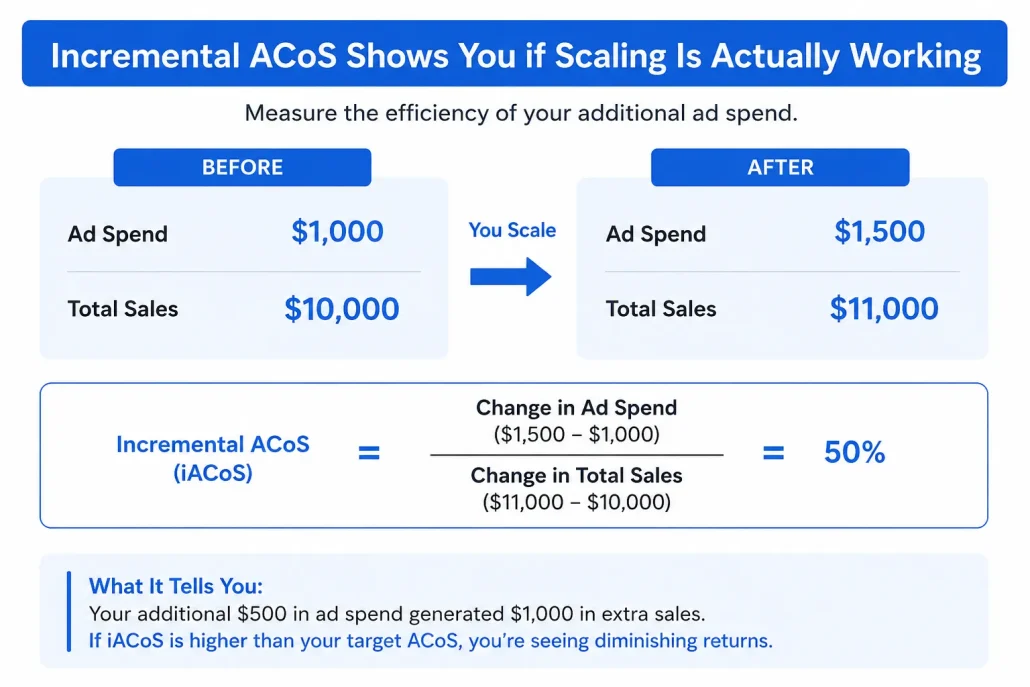
When an established product sells steadily and holds a healthy TACoS, the obvious next move is to scale. You raise budgets, push for top of search, and then watch your profitability drop. This is exactly where TACoS fails you, and where Incremental ACoS (iACoS) becomes the metric worth watching closely.
RANK LIKE THE PROS
Discover a better way to rank products from external traffic, like Facebook, Google and TikTok, with LandingCube promo pages.
Try it free for 21 days.
Incremental ACoS measures the efficiency of your added spend, not your total spend, using this formula:
iACoS = (New Ad Spend minus Old Ad Spend) divided by (New Total Sales minus Old Total Sales)
Here is what that looks like in practice:
Before scaling:
- Ad spend: $1,000 a week
- Total sales: $10,000 a week
- Blended TACoS: 10 percent
After scaling:
- Ad spend: $1,500 a week
- Total sales: $11,000 a week
- Blended TACoS: 13.6 percent
- Incremental ACoS: 50 percent (an extra $500 in spend produced only an extra $1,000 in sales)
The blended TACoS of 13.6 percent might still look fine depending on your margin. But if your gross margin is 35 percent, that scaling push just lost you money, since you paid $500 to earn $350 in gross profit. Tracking iACoS on a weekly basis lets you push your ad spend right up to the point of diminishing returns, instead of past it.
KPIs for a New Product Launch
Launching a product on Amazon is an exercise in managed losses. You have no sales history and no reviews yet, so the A9 algorithm has no reason to trust your listing over an established one. During the first 30 to 45 days, focus on these three KPIs instead of profit:
- Click-Through Rate (CTR): Before anyone can buy, they have to click. If your CTR sits below 0.3 percent on exact match terms, fix your main image and price point before you touch anything else.
- Relative Conversion Rate (CVR): You are not chasing a 20 percent conversion rate on day one. You are chasing a rate that beats your sub-category average, which you can check using Amazon’s Search Query Performance data in Brand Analytics. Converting at 9 percent in a category that averages 8 percent means you are winning the algorithmic battle, even with a 100 percent ACoS.
- Organic Rank Tracking: Watch your keyword velocity. As your target terms climb from page ten to page five to page one, more of your sales shift from paid to organic, and profitability follows close behind.
This shift from paid to organic sales is the Amazon flywheel in action, and it only starts spinning once your launch KPIs are strong enough to earn that organic push.
KPIs for Profit Optimization on Mature Products
Once a product hits its peak market share, the goal changes from aggressive scaling to squeezing out every point of profit. At this stage, generic metrics give way to a few numbers that matter more than the rest:
Contribution Margin Is Your Real Profit Number
Contribution Margin tracks the true profit left over per unit after Amazon’s referral fees, FBA fees, inbound shipping, and PPC costs are subtracted from the sale price. It is calculated as your selling price minus your variable costs, and you can learn the full contribution margin formula and examples from Corporate Finance Institute.
This number is a far better guide for pricing and ad spend decisions than looking at revenue or net margin alone.
Amazon Ads’ own guide on break-even ACoS makes the same point: your ACoS needs to stay below your profit margin, or you are paying to lose money on every sale.
Match Cost Per Click to Customer Value
Compare your Cost Per Click against your average order value, and make sure you know your customer acquisition cost is comfortably below what a customer is worth to you over time, not just on the first sale. Paying $2.50 a click for a product that nets $4.00 in profit only works if your conversion rate can sustain that math, and few products can hold that pace for long.
Automate What Spreadsheets Cannot Keep Up With
This is where the right Amazon PPC Tools become worth the investment. Manual bid adjustments through Seller Central spreadsheets are too slow for mature-product profit harvesting. Pairing automated bidding with Amazon Analytics Tools lets you see ASIN-level profitability in real time, so you know exactly which products are earning their ad budget and which ones are quietly draining it.
Build an Amazon Advertising KPI Dashboard That Ties It All Together
The Amazon PPC metrics that matter most are the ones tied directly to what you are trying to figure out at that moment. Your Amazon ad performance metrics only tell a complete story when you view them together, so a simple Amazon advertising KPI dashboard should organize your data into three layers:
- Visibility: Impression Share, Search Term Impression Share, and your Amazon Attribution off-Amazon numbers.
- Efficiency: ACoS, ROAS, CTR, CVR, and CPC.
- Profitability: TACoS, Incremental ACoS, Contribution Margin, and Brand Referral Bonus credits.
Check your layers in this order when a campaign underperforms:
- Impression Share dropped: the issue is competitive pressure, not your listing.
- Visibility held steady, but efficiency slipped: check your listing, price, or creative before you touch your bids.
- Both look fine: only then bring the conversation back to profitability and ask what the change actually means for your total margin.
The Bottom Line
Profitability on Amazon is not found in a single dashboard number. It shows up when you match your KPIs to keyword intent, your ad format, and your product’s stage in its life cycle. Branded keywords protect what you already have.
Generic keywords fuel the growth that TACoS alone will never explain. Incremental ACoS tells you the truth about scaling, and Contribution Margin tells you the truth about what is left once every fee is paid.
Stop treating TACoS as your only scoreboard. Amazon Ad KPIs beyond TACoS give you the full picture, and once you start tracking them together, you will see exactly where your next ad dollar should go.
LandingCube brings your landing pages, Attribution tracking, and PPC data into one place, so you are not stitching together spreadsheets to find these numbers yourself. Start a free trial with LandingCube and see your real Amazon ad KPIs in one dashboard today.
FAQ: All About Amazon Ad KPIs
Beyond TACoS, track Incremental ACoS, New-to-Brand percentage, Impression Share, Contribution Margin, and Amazon Attribution data. Each one answers a specific question about your ad performance that a single blended metric cannot.
There is no universal good TACoS, since it depends on your product’s life cycle and profit margin. A new launch often runs a TACoS of 20 to 30 percent, while a mature, stable product usually sits closer to 5 to 10 percent.
Neither is more important on its own, because they answer different questions. ACoS shows you how efficient a single campaign is, while TACoS shows you how your total ad spend affects your whole business.
Incremental ACoS measures the efficiency of your added ad spend by dividing the change in spend by the change in total sales. It matters because it tells you if scaling your budget is creating real profit or just diminishing returns.
New-to-Brand metrics show how many of your ad-attributed orders and sales came from customers who have not bought from your brand in the past 12 months. Amazon reports this data directly in your Sponsored Brands and Sponsored Products campaign metrics.
The brand halo effect describes sales of your other products that happen after a shopper clicks an ad for a different item in your catalog. It is a sign that your brand, not just one listing, is building trust with shoppers.
Amazon impression share, also called share of voice, is the percentage of available ad impressions your campaign won for a keyword compared to every other advertiser bidding on it. A low impression share with budget left over usually points to a relevance or bid problem rather than a spend problem.
Amazon Attribution metrics track impressions, clicks, detail page views, add-to-carts, and purchases from your non-Amazon marketing links. They are the only official way to see how traffic from Google, Meta, or TikTok performs once it reaches your Amazon listing.
Contribution margin equals your selling price minus your variable costs, including COGS, Amazon fees, and ad spend per unit. It shows you the real profit left on each sale after ads are accounted for, which revenue or net margin alone will not show you.
No, since the two formats serve different stages of the shopper’s journey. Sponsored Products targets bottom-of-funnel buyers and usually runs a lower ACoS, while Sponsored Brands drives discovery and is better judged by New-to-Brand percentage and Click-Through Rate.
A good CVR depends entirely on your price point and category, so a $10 product and a $500 product will never share the same benchmark. Compare your CVR to your specific sub-category average using Amazon’s Search Query Performance data instead of chasing a fixed number.
Most sellers should expect to break even or run at a loss for the first 30 to 45 days of a launch. During this window, the priority is building clicks, conversions, and reviews so Amazon’s algorithm learns your product is relevant.
LandingCube brings your landing pages, Amazon Attribution tracking, and PPC bid automation into one dashboard, so you can see ASIN-level profitability without building your own spreadsheets. It also helps you set automated rules that scale your best campaigns and pause bleeding keywords before they cut into your margin.
RANK LIKE THE PROS
Discover a better way to rank products from external traffic, like Facebook, Google and TikTok, with LandingCube promo pages.
Try it free for 21 days.