12 Best Amazon Analytics Tools for Sellers (2026 Update)
Amazon provides sellers with more data than most businesses know what to do with. Sales, fees, refunds, advertising, inventory, search performance and customer behavior are all available somewhere—but rarely in one place and rarely in a format that leads directly to a decision. That is where Amazon analytics tools become valuable.
A good analytics platform should help you answer questions such as:
Which SKUs are actually profitable after Amazon fees, advertising, refunds and cost of goods?
Why did sales increase or decline?
How dependent are total sales on advertising, and does the available evidence suggest that paid activity is contributing incremental growth?
Which products are losing conversion?
Where is inventory tying up too much cash?
Which operational problems need attention before they become expensive?
The difficulty is that “Amazon analytics software” is not one clear product category. A profit-and-loss dashboard, an advertising platform, an inventory forecasting system and a listing-monitoring tool may all be described as analytics software, even though they solve very different problems. That means there is no single best platform for every seller.
The right choice depends on what you sell, how many ASINs and marketplaces you manage, how much you spend on advertising, how complex your cost structure is and which decisions you currently struggle to make.
In this guide, we compare the leading Amazon analytics tools by use case, not simply by the number of features they advertise. We examine their strengths, limitations, pricing, and suitability for different types of sellers so you can identify the platform that best matches your reporting needs.
This guide focuses primarily on analyzing the performance of products that are already live. Sellers who are still trying to decide what to launch should read our separate comparison of the best Amazon product research tools, which covers niche discovery, estimated demand, competition, sourcing and pre-launch validation.
TL;DR: The Best Amazon Analytics Tools at a Glance
The best Amazon analytics tool is not necessarily the platform with the largest feature list. It is the one that answers your most important business question clearly and accurately.
A seller who cannot determine which SKUs are genuinely profitable needs something different from an agency managing advertising across dozens of accounts. Likewise, a listing-monitoring platform and a reimbursement service should not be judged as direct alternatives to a profit-and-loss dashboard.
We have therefore compared the tools below by their strongest use case rather than treating the list as a universal ranking. Use the table to compare current pricing and primary use cases, then read the detailed reviews for features, suitability, and important limitations.
Our quick recommendations:
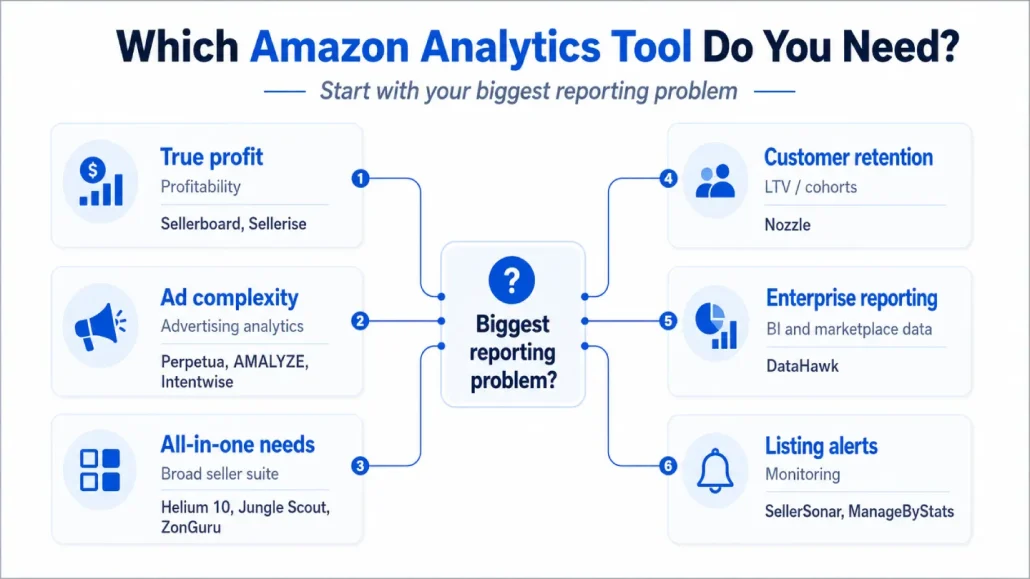
Helium 10 is the strongest broad all-in-one option in this comparison,
while Sellerboard is the best fit for dedicated profitability tracking.
Perpetua and AMALYZE stand out for advertising analytics and optimization,
Nozzle specializes in customer and lifetime-value analytics, SellerSonar
focuses on listing monitoring, and Intentwise is built for larger brands,
agencies, and advanced retail-media teams.
Comparison of the best Amazon analytics tools by use case, pricing,
strengths, and limitations
Custom contract pricing based on products, connected accounts,
data sources, and advertising requirements.
Connects advertising, retail, inventory, pricing, shopper, and
competitive data with analytics and optimization tools.
Pricing is not publicly listed, and its enterprise-level depth may
be unnecessary for smaller advertising accounts.
Pricing checked: August 6, 2026. Prices are shown in US dollars before applicable taxes. Annual prices are displayed as monthly equivalents but generally require upfront annual billing. Features, account limits, and prices can change, so confirm current terms with the provider before subscribing.
Note: These tools are organized by their strongest use case rather than ranked on one universal scale. GETIDA is covered separately as an adjacent FBA reimbursement-auditing service rather than counted as a general Amazon analytics platform.
Amazon Analytics Tools vs. Amazon Product Research Tools
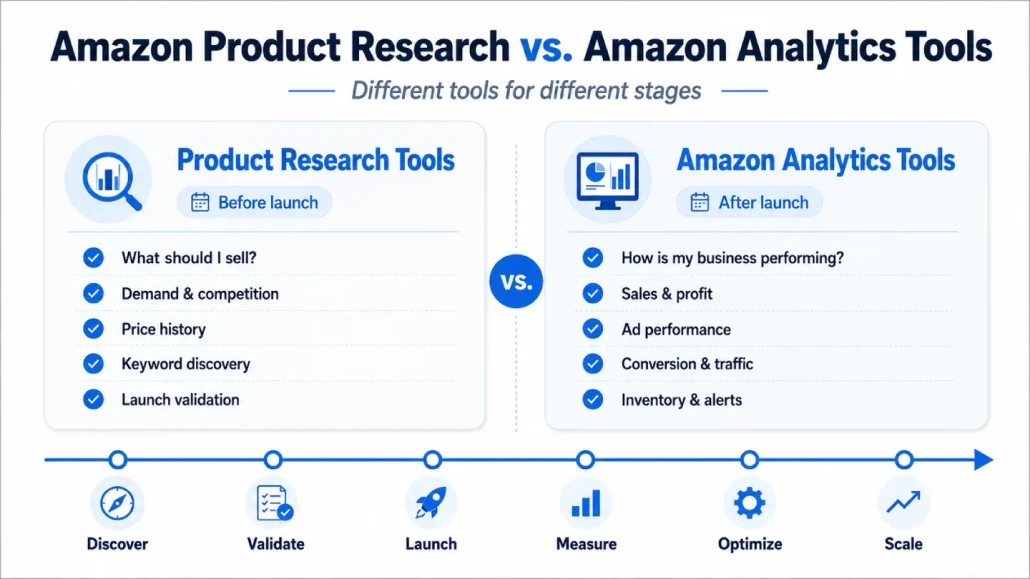
Amazon analytics tools and Amazon product research tools both use marketplace data, but they are designed for different stages of the seller journey.
A product research tool is primarily used before a sourcing or launch decision. It helps sellers estimate demand, evaluate competition, examine price and sales-rank history, discover keywords and determine whether a product opportunity appears commercially viable.
Its central question is:
Should I sell this product?
An Amazon analytics tool is primarily used once a product is already selling. It brings together data such as revenue, fees, advertising spend, refunds, sessions, conversion, inventory and customer behavior.
Its central question is:
What is happening in my business, why is it happening and what should I do next?
Looking for product-discovery data? Product Opportunity Explorer, Keepa, camelcamelcamel, and Amazon sales-estimation platforms are primarily used for niche validation, price-history analysis, sourcing, and pre-launch research. We cover these tools separately in our guide to the best Amazon product research tools.
What Should an Amazon Analytics Tool Help You Understand?
Amazon analytics software should not merely present more charts. It should help you connect business outcomes to their likely causes.
For most Amazon sellers, that means answering five groups of questions.
Are You Actually Making Money?
Revenue is only the starting point.
A useful profitability dashboard should account for Amazon fees, advertising, refunds, promotions and cost of goods sold. Depending on the seller’s business model, it may also need to include freight, duties, packaging, prep, storage, VAT, currency conversion and external fulfillment costs.
The most valuable feature is not necessarily one large account-level profit number. It is the ability to segment that number by SKU, child ASIN, parent ASIN, brand, supplier, marketplace and period.
A blended account margin can hide the fact that one high-revenue product is losing money while a smaller SKU is producing a much healthier return.
Why Did Sales Change?
A decline in revenue does not explain itself.
Sales may fall because traffic declined, conversion weakened, Buy Box ownership changed, advertising was reduced, the product went out of stock, a competitor lowered its price or customer reviews deteriorated.
Analytics software should make it easy to compare:
Sessions
Conversion rate
Ordered units
Revenue
Buy Box percentage
Organic and paid sales
Price
Inventory availability
Return and refund activity
The objective is to move from “sales went down” to a useful diagnosis.
Is Advertising Supporting Profitable Growth?
ACoS is important, but it does not tell the whole story.
A campaign can have an attractive ACoS while promoting a product with weak margins. Conversely, a campaign with a relatively high ACoS may still support a profitable launch or contribute to organic growth.
A strong analytics platform should help sellers examine advertising in the context of total business performance. That means reviewing ACoS alongside TACoS, contribution margin, total sales, organic sales and inventory availability.
The more complex the advertising operation becomes, the more important it is to understand attribution, budget pacing, placement performance, search-term trends and the relationship between paid and organic sales.
Is Inventory Supporting or Restricting Growth?
Inventory analytics connects sales performance with cash flow.
Too little stock can lead to lost sales, interrupted campaigns and declining organic momentum. Too much stock ties up capital and increases storage exposure.
Useful inventory analytics should help sellers understand:
Sales velocity
Days of inventory cover
Reorder timing
Lead-time risk
Inbound inventory
Aged stock
Excess units
Stockout risk
Stranded or unfulfillable inventory
Inventory recommendations should be treated as forecasts rather than guarantees. Sellers should be able to adjust lead times, safety stock and demand assumptions to reflect their own operating reality.
What Needs Attention Right Now?
Not every important event appears first in a sales report.
Listing suppression, Buy Box loss, price changes, hijackers, review deterioration, stockouts, unusual return activity and advertising anomalies can all damage performance before the account-level numbers make the cause obvious.
Monitoring and alert functionality can therefore be as important as historical reporting.
The best alert system is not the one that sends the most notifications. It is the one that helps the seller identify costly exceptions without creating so much noise that the warnings are ignored.
For a deeper explanation of Amazon’s native search and customer data, read our guide to Amazon Brand Analytics. Sellers researching products to launch should instead see our comparison of the best Amazon product research tools.
Why Amazon Analytics Tools Show Different Numbers
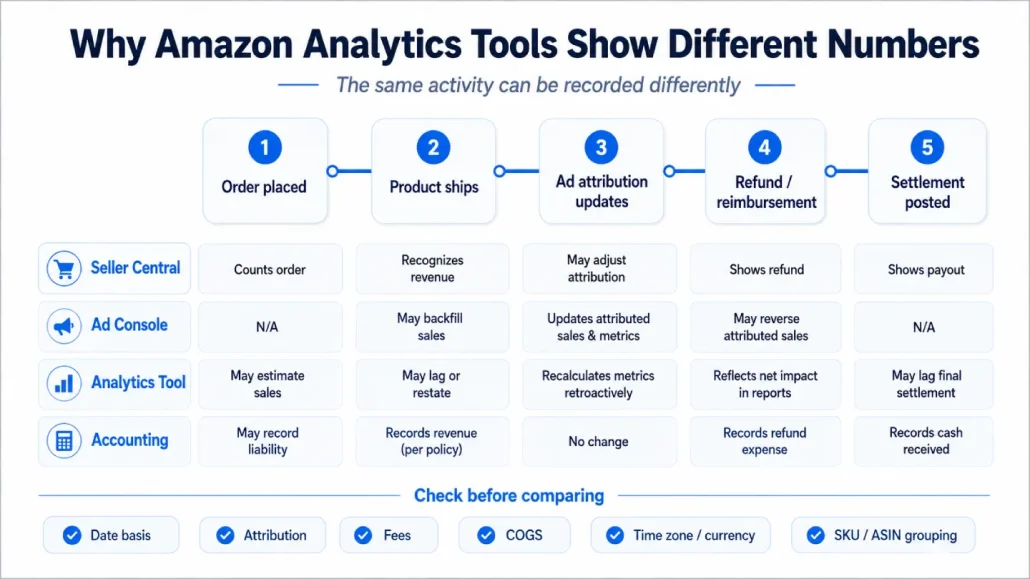
It is common for Seller Central, the Amazon Advertising Console, an analytics platform, and your accounting software to show different figures for the same reporting period. This does not automatically mean that one platform is inaccurate. In many cases, the systems use different dates, data sources, attribution rules, and calculation methods.
Order, Shipment, and Settlement Dates
One platform may record revenue on the date a customer places an order, while another recognizes it when the order ships. Accounting software may use the date the transaction appears in an Amazon settlement.
These methods answer different questions. Order-date reporting is useful for analyzing demand and advertising, while shipment or settlement data is generally more appropriate for financial reconciliation.
Before comparing two platforms, confirm that they use the same reporting basis.
Advertising Attribution
Advertising sales may occur several days after a shopper clicks an ad. Amazon can then attribute the purchase back to the campaign according to its applicable attribution rules.
This means recent advertising results may continue changing as additional purchases, refunds, or attribution adjustments are recorded. Sellers should avoid treating the most recent day or two as finalized performance.
A third-party platform should clearly explain which advertising data it uses, how often it refreshes, and whether historical results are updated when Amazon revises attribution.
Refunds and Reimbursements
A sale and its refund may appear in different reporting periods.
One tool may connect the refund to the original order, while another records it on the date the refund was processed. Reimbursements for lost or damaged inventory may appear even later.
Both methods can be valid, but they will produce different monthly totals. Operational reporting may connect every event to the original order, while accounting reports usually follow the actual transaction date.
Estimated and Actual Fees
Some analytics tools estimate Amazon fees as soon as an order is placed so sellers can see an immediate profit estimate. Others wait for actual transaction or settlement data.
Estimated fees provide faster directional information, but actual fees are generally more suitable for reconciliation. A reliable tool should explain which charges are estimated and whether they are replaced when final figures become available.
Cost of Goods Sold
Amazon does not know what you paid to manufacture, purchase, ship, package, or prepare a product. These costs must usually be entered manually or imported from another system.
Profit figures can therefore differ when tools use different COGS values or apply the current product cost to historical orders. Platforms that support cost changes by effective date generally provide more reliable historical profitability reporting.
Time Zones, Currencies, and Taxes
A transaction completed near midnight may appear on different dates depending on whether a platform uses marketplace time, account time, browser time, or UTC.
International sellers must also account for currency conversion, VAT, taxes, and marketplace-specific fees. When comparing platforms, use the same date range, marketplace, time zone, currency, and tax settings.
Product Grouping
Amazon may report data by SKU or child ASIN, while a third-party platform may combine several variations under one parent ASIN.
The total account result may match even when individual product figures appear different. A useful analytics tool should allow sellers to move between SKU, child ASIN, parent ASIN, brand, account, and marketplace views.
How to Compare Analytics Platforms Fairly
Use a completed historical period rather than the current week. Compare the same marketplace, products, date range, and time zone, then check sales, advertising spend, fees, refunds, COGS, and product grouping.
Small differences may have a reasonable explanation. Large discrepancies that the provider cannot explain are a warning sign.
How to Choose an Amazon Analytics Tool
Start with the business question you need the software to answer. Then compare platforms based on their data sources, calculation methods, reporting depth, integrations, and total cost rather than simply choosing the tool with the longest feature list.
Criteria for choosing an Amazon analytics tool
What to Evaluate
Why It Matters
Primary use case
Decide whether you primarily need profitability, advertising,
inventory, customer, monitoring, competitive, or broader
all-in-one analytics. A specialist PPC platform and a profit
tracker solve different problems.
Data sources
Check whether the platform uses official Amazon APIs and reporting
datasets, seller-entered costs, accounting integrations, or
estimated marketplace data. The source affects what the tool can
measure reliably.
Calculation transparency
The platform should explain how it treats Amazon fees, advertising
attribution, refunds, COGS, taxes, currencies, and product
groupings. Avoid dashboards that present important figures without
showing how they were calculated.
Data freshness
Sales, advertising, inventory, and financial data may update on
different schedules. Faster reporting is useful for alerts and
campaign management, while settled data is more suitable for
financial reconciliation.
Reporting and segmentation
Look for the ability to analyze performance by SKU, child ASIN,
parent ASIN, brand, campaign, account, and marketplace. Broad
account totals can hide weak products and costly problems.
Marketplace and account coverage
International sellers and agencies should confirm support for
every required marketplace, seller account, currency, time zone,
and tax structure. Technical support for multiple accounts does
not always mean complete reporting depth.
Integrations and exports
Consider whether the platform connects to your accounting,
advertising, inventory, spreadsheet, or business-intelligence
systems. You should also be able to export your underlying data in
a usable format.
Security and permissions
Review what account access the platform requests, whether access
is read-only, how users are managed, and how authorization can be
revoked. Larger teams may also require role-based permissions and
audit controls.
Pricing and account limits
Check whether pricing changes with revenue, orders, ASINs,
marketplaces, users, or connected accounts. A low starting price
can become expensive as the business grows.
Key takeaway: Choose the platform that best answers your primary business question. Add a specialist tool only when it provides a capability your existing software cannot deliver.
How We Researched and Compared These Amazon Analytics Tools
The platforms in this guide were compared according to their primary use cases rather than judged as though every tool solved the same problem. We reviewed official product pages, documentation, plan details, and pricing information available on August 6, 2026.
We compared each platform based on its data sources, reporting depth, actionability, integrations, usability, limitations, and price-to-value. Where a vendor did not publish a standard price, we marked its pricing as custom.
Unless a review explicitly states otherwise, inclusion in this guide should not be interpreted as a live-account test of every feature. Product capabilities, prices, and plan limits can change, so sellers should confirm the latest terms before subscribing.
Criterion
What we looked at
Data accuracy & refresh
How completely the tool captures fees and COGS, and how often the data updates.
Breadth of coverage
Which analytics areas (profit, ads, keywords, inventory, competitors) it covers well.
Actionability
Whether it surfaces alerts, trends and recommendations — not just raw exports.
Integrations
How cleanly it connects to Amazon’s SP-API and your accounting or PPC stack.
Usability
Learning curve, interface clarity and quality of onboarding.
Price-to-value
What you get at each tier versus alternatives — including free options.
“Best” is meaningless without a yardstick, so here’s ours. We judged every tool below against the same six criteria, the ones that actually separate a useful analytics platform from a pretty dashboard.
Data accuracy and refresh speed.
Analytics are only as good as the numbers behind them. We looked at how completely each tool captures Amazon’s many fee types, how it handles cost of goods sold (COGS), and how often it refreshes — because daily data means you’re reacting to yesterday, while near-real-time data lets you catch a margin drop mid-promotion.
Breadth of coverage.
Amazon analytics spans profit, advertising, keywords, inventory, and competitor intelligence. We noted which of those areas each tool covers well, and which it leaves to others, so you can tell an all-in-one suite from a specialist.
Actionability.
Raw data isn’t insight. We favored tools that surface clear signals (alerts, trends, and recommendations) over those that simply export numbers you still have to interpret yourself.
Integrations.
A tool that plugs cleanly into Amazon’s SP-API (and, where relevant, your accounting or PPC stack) saves hours of manual exporting. We weighed how smoothly each connects to the data sources sellers actually use.
Usability.
A dashboard you dread opening doesn’t get used. We considered the learning curve, the clarity of the interface, and the quality of onboarding.
Price-to-value.
Margins are thin, so we weighed what each tool delivers at each price tier against the alternatives — and flagged where a free or native option does the job just as well.
To pressure-test our hands-on impressions, we cross-referenced verified user reviews from G2, Capterra, and Trustpilot, plus discussions in active Amazon-seller communities. Pricing was confirmed against each vendor’s public pricing page at the time of writing; plans change often, so always verify before you buy.
In-Depth Reviews of the 12 Best Amazon Analytics Tools
The platforms in this guide are not interchangeable. Some are designed to calculate product-level profit, while others specialize in advertising, customer analytics, operational reporting, listing monitoring, or reimbursement recovery.
For that reason, the reviews below do not treat every platform as a direct competitor. Instead, each review explains the problem the tool is best equipped to solve, the features that distinguish it, and the type of seller most likely to receive sufficient value from it.
Just as importantly, each review includes a “Who Should Skip It?” section. Amazon software subscriptions can quickly become expensive when several platforms provide overlapping functionality. A tool can be powerful and well designed while still being the wrong choice for your catalog, budget, team, or current stage of growth.
Helium 10: Best All-in-One Amazon Analytics Suite
Helium 10 combines profitability reporting, keyword tracking, market analysis, inventory management, listing tools, and product research in one platform.
Its Profits dashboard helps sellers monitor revenue, margins, refunds, and product performance. Keyword Tracker shows how important search terms move over time, while Market Tracker provides visibility into competitors and broader niche performance. Its inventory features also help sellers forecast demand and avoid stockouts.
What Stands Out
Helium 10’s biggest advantage is breadth. Sellers can analyze profitability, organic visibility, competitors, and inventory without maintaining a separate subscription for every task.
That convenience is valuable for small teams managing several parts of an Amazon business. The tradeoff is that users may need time to learn the platform, and some sellers will use only a fraction of the available tools.
Who Should Choose It?
Choose Helium 10 if you run a growing private-label business and want one platform for analytics, keywords, listings, inventory, and research.
It is particularly suitable for sellers that value convenience and broad functionality over specialist depth.
Who Should Skip It?
Skip Helium 10 if you only need a focused profit-and-loss dashboard. A dedicated profitability tool may be simpler and more cost-effective.
Very small sellers may also pay for features they are not yet ready to use.
Jungle Scout Catalyst: Best for Analytics and Product Research Combined
Jungle Scout Catalyst combines product research with sales analytics, advertising analytics, keyword tracking, product monitoring, and inventory planning.
Its Sales Analytics tools help sellers review revenue, expenses, and product-level profitability. Inventory Manager uses sales history to estimate stock requirements, while Rank Tracker monitors keyword performance.
The platform is most useful for sellers that want to move from product discovery into post-launch analysis without changing software.
What Stands Out
Jungle Scout offers an accessible combination of research and operational analytics.
Its interface is approachable for newer sellers, and its inventory and sales tools can reduce reliance on manually maintained spreadsheets. The research functionality also remains useful for brands that regularly expand their catalogs.
However, the platform’s strongest reputation remains tied to product and market research rather than advanced financial reporting.
Who Should Choose It?
Choose Jungle Scout if you are a new or growing private-label seller that needs product research, sales analytics, keyword tracking, and inventory planning in one place.
It is a good fit for small teams that prioritize ease of use.
Who Should Skip It?
Skip Jungle Scout if you already have a product-research platform and mainly need detailed profitability analysis.
Sellers with complex landed costs, multiple entities, or advanced financial-reporting requirements should verify that its reporting is sufficiently granular.
Sellerboard: Best for Amazon Profitability Tracking
Sellerboard is designed primarily to help Amazon sellers understand their actual profit after fees, advertising, refunds, COGS, and other expenses.
Its dashboards allow users to analyze performance by product and period. Sellers can manage changing COGS, track returns, include indirect expenses, and monitor financial trends across the business.
What Stands Out
Sellerboard focuses on a problem Amazon’s native reports do not solve cleanly: determining how much money each product actually generates.
Historical COGS management is particularly valuable when manufacturing or freight costs change. Its refund and expense reporting also provides a more realistic picture than a simple revenue dashboard.
The main limitation is that Sellerboard does not attempt to replace advanced keyword, research, or PPC platforms.
Who Should Choose It?
Choose Sellerboard if you have outgrown spreadsheets and want a dedicated SKU-level profitability dashboard.
It is especially useful for established private-label and wholesale sellers whose margins are materially affected by advertising, refunds, and changing product costs.
Who Should Skip It?
Skip Sellerboard if you want one platform for product research, listing optimization, and advanced campaign automation.
Very small sellers with only a few products may be able to manage profitability manually until their reporting becomes more complex.
Sellerise: Best for Profit and Operational Analytics
Sellerise combines profit reporting with operational features such as ABC analysis, PPC dashboards, reimbursements, inventory tools, and review monitoring.
Its P&L reporting helps sellers examine net profit, margin, ROI, promotions, and advertising performance. ABC analysis can also identify which products contribute most to the business.
What Stands Out
Sellerise offers more operational breadth than a basic profitability dashboard.
Its product segmentation can help sellers prioritize inventory and management attention, while its financial reporting brings sales, advertising, and expenses into one view.
The broader feature set may reduce the need for several separate subscriptions, although it also requires more setup than a narrowly focused P&L tool.
Who Should Choose It?
Choose Sellerise if you manage a growing Amazon catalog and want financial analytics, product segmentation, PPC visibility, and reimbursement tools in one platform.
It is well suited to established sellers that want broader operational support.
Who Should Skip It?
Skip Sellerise if you only need a simple profitability dashboard or already use specialist tools for PPC, reimbursements, and reviews.
Multi-channel sellers should also confirm that the available integrations support their wider e-commerce operation.
DataHawk: Best for Larger Brands and Analytics Teams
DataHawk combines sales, keyword, competitive, product, and marketplace analytics within a broader data platform.
It helps teams monitor internal performance alongside external changes in keywords, categories, brands, competitors, and products. Its API and composable analytics capabilities also support custom reporting and integrations.
What Stands Out
DataHawk’s strength is its data breadth and flexibility.
Larger teams can combine Amazon marketplace information with their own business-intelligence workflows, executive dashboards, and recurring reports. Its competitive and search data also provides more context than an internal sales dashboard alone.
The tradeoff is complexity. Smaller sellers may not need the volume of data or customization the platform provides.
Who Should Choose It?
Choose DataHawk if you are an established brand, agency, aggregator, or analytics team that needs broad marketplace visibility and customizable reporting.
It is particularly relevant when several stakeholders need access to Amazon data.
Who Should Skip It?
Skip DataHawk if your primary need is a straightforward monthly profit figure.
Small teams without dedicated analytical resources may find a simpler dashboard easier to implement and act upon.
Nozzle: Best for Customer and Lifetime-Value Analytics
Nozzle focuses on customer behavior rather than only product or campaign performance.
Its analytics cover customer acquisition cost, lifetime value, purchase intervals, repeat purchases, cohorts, and purchasing behavior. These insights can help brands understand whether customers return and how much they may be worth over time.
What Stands Out
Nozzle helps sellers move beyond evaluating every sale as a separate transaction.
Lifetime-value and cohort analysis can support more informed acquisition decisions, particularly when repeat customers generate substantial long-term revenue. Purchase-interval data can also inform retention and retargeting strategies.
These features are less useful when products are normally purchased only once or when the seller has limited customer history.
Who Should Choose It?
Choose Nozzle if you sell replenishable products and want to understand customer acquisition, repeat purchasing, and lifetime value.
It is best suited to established brands with enough sales history to identify meaningful customer patterns.
Who Should Skip It?
Skip Nozzle if your products are infrequent purchases or your main concern is SKU-level profit and fee reconciliation.
New sellers may also lack enough historical data to benefit fully from cohort analysis.
AMALYZE: Best for Amazon Ads and Search Intelligence
AMALYZE is primarily an Amazon advertising and search-intelligence platform. It combines target-based campaign optimization with search-term, placement, and marketplace analysis, helping advertisers understand where spend is producing sales and where targeting, bids, or budgets may need adjustment.
The platform also provides broader search and marketplace insights, although sellers should check the current availability of individual modules because some analytics and listing capabilities may still be labeled Beta or Early Access.
What Stands Out
AMALYZE offers considerable analytical depth.
Its combination of internal product data and external marketplace information can help explain whether performance changes were caused by the seller’s own activity or by competitors, search trends, pricing, or category movement.
The downside is that the volume of information can feel overwhelming, particularly for sellers that want only a few core metrics.
Who Should Choose It?
Choose AMALYZE if you are an experienced seller, agency, or brand that needs detailed keyword, competitor, and marketplace intelligence.
It is particularly suitable for highly competitive categories where search visibility changes frequently.
Who Should Skip It?
Skip AMALYZE if you need only basic sales and profitability reporting.
New sellers and small teams may struggle to justify the platform unless someone regularly reviews and acts on the available data.
Perpetua: Best for Advanced Amazon Advertising Analytics
Perpetua is primarily an advertising optimization and analytics platform.
It helps sellers manage campaign goals, budgets, targeting, and performance while using automation to reduce the amount of manual campaign work required. Its dashboards cover metrics such as sales, spend, impressions, and ACoS.
What Stands Out
Perpetua combines advertising reporting with campaign automation.
This is especially valuable when a business manages enough campaigns, products, and targets that manual bid and budget adjustments become inefficient.
However, Perpetua should not be mistaken for a complete business P&L. Advertising results still need to be evaluated alongside product margins, COGS, and inventory.
Who Should Choose It?
Choose Perpetua if you are an established seller, brand, or agency with meaningful Amazon advertising spend.
It is best suited to teams that need stronger automation and reporting than Amazon’s native Advertising Console provides.
Who Should Skip It?
Skip Perpetua if your advertising account is small and easy to manage manually.
You should also choose another platform first if your biggest problem is calculating true product-level profitability rather than optimizing campaigns.
ZonGuru: Best for Small and Mid-Sized Private-Label Brands
ZonGuru combines sales monitoring, competitor tracking, review analysis, listing optimization, brand protection, and other Amazon seller tools.
Its Business Dashboard provides a central view of performance, while Sales Spy tracks competitors and Love-Hate analyzes patterns in customer reviews. IP Monitor can also help identify unauthorized sellers and potential listing issues.
What Stands Out
ZonGuru connects analytics with practical listing and brand-management workflows.
Sellers can use competitor and customer data to identify potential listing improvements, while monitoring tools help protect existing performance.
Its breadth is convenient, although individual features may not provide the same depth as dedicated profitability, PPC, or monitoring platforms.
Who Should Choose It?
Choose ZonGuru if you run a small or mid-sized private-label brand and want analytics, listing tools, competitor monitoring, and brand protection within one system.
Who Should Skip It?
Skip ZonGuru if you already use established platforms for research, listings, monitoring, and profitability.
Larger brands requiring enterprise reporting or advanced PPC automation may also need more specialized software.
ManageByStats by Carbon6: Best for Amazon Operational Dashboards
ManageByStats is a Carbon6 platform that centralizes Amazon sales, profit, KPI, product, inventory, customer, and reporting data. It is designed to give sellers a clearer operational view of their Amazon business without relying on multiple Seller Central exports.
Carbon6 also offers separate products for inventory planning, reimbursements, fee auditing, and other operational requirements. Those products may complement ManageByStats, but they are not automatically included as ManageByStats features.
What Stands Out
The Carbon6 ecosystem allows sellers to assemble several Amazon operations tools through one broader provider.
This may simplify vendor management for businesses that need inventory forecasting, reimbursement support, reporting, and operational insights. The individual tools also address practical problems with direct financial consequences.
The challenge is determining which modules are genuinely needed and whether the combined cost is justified.
Who Should Choose It?
Choose ManageByStats if you are an established seller that needs centralized Amazon dashboards, automated reporting, inventory visibility, and operational performance tracking.
Who Should Skip It?
Skip the wider ecosystem if you only need one simple analytics function.
Smaller sellers should avoid paying for several modules before their catalog and sales volume create a clear operational need.
SellerSonar: Best for Listing Monitoring and Alerts
SellerSonar monitors changes that could affect listing visibility, conversion, or sales.
Its alerts may cover listing hijackers, Buy Box changes, product suppression, reviews, prices, keyword rankings, and alterations to product pages.
Unlike a profitability dashboard, SellerSonar is designed to detect problems quickly rather than explain the complete financial performance of the account.
What Stands Out
SellerSonar’s main advantage is proactive monitoring.
It can reduce the time between a listing problem occurring and the seller noticing it. This becomes increasingly valuable as the catalog grows and manually checking every ASIN becomes impractical.
Its effectiveness depends on the speed and relevance of the alerts. Excessive or delayed notifications can reduce their value.
Who Should Choose It?
Choose SellerSonar if you manage enough ASINs that manual monitoring is no longer reliable.
It is particularly useful when hijackers, Buy Box loss, suppression, or unwanted listing changes represent meaningful risks.
Who Should Skip It?
Skip SellerSonar if you manage only a small catalog that can be checked manually.
It should also not be treated as a substitute for profitability reporting or PPC analytics.
Intentwise: Best for Agencies and Advanced Advertisers
Intentwise combines Amazon advertising optimization, reporting, automation, and data analytics.
Its Ad Optimizer supports campaign management, while Explore and Analytics Cloud help teams organize data, investigate performance, and build more advanced reporting workflows.
The platform is designed for businesses managing more complex advertising environments rather than occasional campaign activity.
What Stands Out
Intentwise combines advertising execution with a deeper analytics layer.
This is useful for agencies and brands that need to compare multiple campaigns, products, or accounts and convert large amounts of advertising data into structured reports.
Its sophistication may be unnecessary for sellers with a small number of straightforward campaigns.
Who Should Choose It?
Choose Intentwise if you are an agency, aggregator, larger brand, or specialist advertising team managing substantial Amazon ad spend.
It is particularly valuable when multi-account reporting and automation are important.
Who Should Skip It?
Skip Intentwise if your campaigns can still be managed comfortably through Amazon’s Advertising Console or a simpler PPC platform.
It will also not replace a dedicated product-level profitability system.
Adjacent Specialist Service: GETIDA for FBA Reimbursement Auditing
GETIDA is not included in our main Amazon analytics-tool ranking. It is a specialist FBA auditing and reimbursement service rather than a general platform for analyzing sales, profitability, advertising, inventory, conversion, or customer behavior.
GETIDA reviews Amazon FBA transactions for potentially eligible discrepancies and assists with the related reimbursement process. Depending on the account and claim type, the service may examine lost, damaged, destroyed, or improperly accounted-for inventory, inbound shipment discrepancies, removal-order problems, fee overcharges, and other FBA-related issues. GETIDA also manages documentation and eligible claims on behalf of sellers rather than merely displaying the discrepancies in a dashboard.
That specialization can still make GETIDA relevant to Amazon sellers, but its role has changed as Amazon has automated more of the reimbursement process.
Amazon now says that almost all eligible warehouse lost-and-damaged and customer-return reimbursement cases are proactively reimbursed. Sellers may still need to submit manual claims when an expected automatic reimbursement does not occur, and removal-order claims continue to require manual filing.
Amazon also changed how certain reimbursements are calculated. Effective March 10, 2025, inventory lost or damaged before a customer order is reimbursed based on the product’s manufacturing cost. Amazon’s definition excludes expenses such as shipping, handling, and customs duties. Items lost or damaged after a customer order continue to be treated differently under the applicable policy.
These changes do not make specialist FBA auditing irrelevant. They do, however, mean that sellers should evaluate the service based on the claims Amazon does not automatically resolve, the complexity of their FBA operation, and the amount of internal work required to identify, document, submit, and monitor eligible cases.
What Stands Out
GETIDA combines transaction auditing with a managed claims process.
A standard analytics platform might flag an unusual inventory adjustment or fee. GETIDA is designed to take the process further by investigating the discrepancy, assembling supporting information, managing eligible cases, and tracking the reimbursement workflow.
This can save time for sellers managing large catalogs, frequent inbound shipments, several marketplaces, or substantial FBA inventory movement. Those businesses may find it difficult to review every adjustment, removal order, receiving discrepancy, and reimbursement manually.
The value will vary considerably by account. Sellers should not assume that every audit will produce a large recovery, particularly now that Amazon proactively processes many common reimbursement cases.
Who Should Consider GETIDA?
GETIDA is most relevant to established FBA sellers with significant inventory volume and operational complexity.
It may be worth considering when:
The business handles frequent inbound shipments and inventory transfers.
The catalog is too large to audit reliably by hand.
Several employees currently spend time researching and filing claims.
The seller has removal orders, receiving discrepancies, or other cases that still require manual attention.
The business lacks an internal reimbursement or reconciliation process.
Potentially missed claims would be financially meaningful.
For these sellers, the decision is partly about recovered funds and partly about whether outsourcing the administrative work is more efficient than handling it internally.
Who Should Skip It?
GETIDA is unlikely to be the right starting point for small sellers with limited FBA inventory movement.
It should also be skipped by anyone looking for a general Amazon analytics platform. The service does not replace a profitability dashboard, advertising analytics platform, inventory forecasting system, customer analytics tool, or listing-monitoring solution.
Sellers that already have an effective internal auditing process may not require an external reimbursement service either. Before connecting an account, compare the pricing structure with the realistic value of the eligible cases, review which claim categories are covered, understand what account permissions are requested, and confirm how reversals or later inventory adjustments are handled.
GETIDA should therefore be viewed as an optional specialist service, not a required component of every Amazon analytics stack.
Recap: Picking the Right Amazon Analytics Tool
The best Amazon analytics tool is the one that solves your most important reporting problem without adding unnecessary cost or complexity.
Choose a profitability platform when you cannot confidently calculate SKU-level profit. Choose an advertising platform when campaign scale makes manual analysis inefficient. Inventory, monitoring, customer analytics, and reimbursement tools should be added only when those areas create a specific operational gap.
All-in-one suites are often the most practical choice for smaller teams that need several capabilities under one subscription. Specialist platforms become more valuable as the business grows and requires greater depth in one area.
The most effective analytics stack is usually the smallest one that answers your important business questions. Start with one core platform, then add another tool only when it provides a capability your current software cannot deliver. Avoid paying for several products that generate substantially the same reports.
Frequently Asked Questions About Amazon Analytics Tools
What is an Amazon analytics tool?
An Amazon analytics tool collects and organizes data such as sales, fees, advertising, inventory, traffic, conversion, and refunds. It helps sellers understand performance, identify problems, and make better decisions.
What is the best Amazon analytics tool?
There is no single best tool for every seller. The right choice depends on whether your main priority is profitability, advertising, inventory, monitoring, customer behavior, or broader all-in-one reporting.
Do I need a paid Amazon analytics tool?
Small sellers may be able to use Seller Central reports and spreadsheets initially. Paid software becomes worthwhile when manual reporting is too time-consuming, data is fragmented, or accurate product-level profit is difficult to calculate.
What should I look for in an Amazon analytics tool?
Evaluate data accuracy, refresh frequency, marketplace coverage, COGS handling, segmentation, exports, integrations, and account limits. Most importantly, choose a platform that answers a specific business question your current reporting cannot resolve.
How do Amazon analytics tools calculate profit?
Profitability tools generally subtract Amazon fees, advertising, refunds, COGS, and other expenses from sales. The result is only reliable when product costs, freight, duties, packaging, and other seller-entered expenses are accurate.
Why do Amazon analytics tools show different numbers, and which one is accurate?
Differences may result from reporting dates, attribution rules, refunds, COGS, time zones, currencies, or product grouping. Validate the tool against a completed Seller Central reporting period and investigate any large discrepancies the provider cannot explain.
How often do Amazon analytics tools update?
Update frequency ranges from hourly or daily to weekly or monthly, depending on the platform and dataset. Recent figures may continue changing as orders ship, refunds occur, and Amazon revises advertising attribution.
Should I choose an all-in-one or specialist analytics tool?
All-in-one platforms are convenient for sellers who need several functions under one subscription. Specialist tools are usually better when deeper profitability, advertising, inventory, or customer analytics are required.
How many Amazon analytics tools do I need?
Most sellers need one core reporting platform and, at most, one or two specialist tools. Add another subscription only when it fills a clear gap rather than duplicating dashboards you already have.
Can Amazon analytics tools combine multiple accounts and marketplaces?
Many platforms can consolidate several seller accounts or marketplaces, but support varies by provider and plan. Check marketplace coverage, currency conversion, VAT handling, account limits, permissions, and whether results can still be segmented by account and country.
Do Amazon analytics tools work for both FBA and FBM sellers?
Many tools support both fulfillment models, but FBM reporting usually requires more manual cost inputs. Sellers may need to add postage, packaging, warehouse labor, fulfillment, and return-shipping expenses.
Are Amazon analytics tools secure?
Use tools that connect through Amazon’s official authorization process and clearly explain their permissions and data practices. Review authentication controls, user access, export options, retention policies, and how access can be revoked.