
Sep 20th 2023
Resources
- Facebook Ads for Amazon [Video Course]
- Drive Traffic To Amazon [Ultimate Guide]
- Get More Amazon Reviews [Ultimate Guide]
Amazon is a vast and competitive marketplace, and success as a seller requires a range of skills. Among these, inventory management stands out as one of the most underrated yet crucial aspects of running a profitable Amazon business.
Ordering too little can lead to running out of stock and missed sales opportunities, while ordering too much results in increased storage costs and tying up excess cash in inventory.
Let’s run a scenario: you’ve got a product that’s a hot seller, and you’re riding a wave of success. Wait, you ordered a bit too conservatively, and boom! You’re out of stock. That’s right, customers can’t buy what you don’t have, and that means you’re not only missing out on sales but also losing precious Amazon ranking.
On the flip side, let’s say you decide to go all-in and order an abundance of inventory. You’re brimming with optimism about future sales. The downside? You’re now staring at increased storage costs and a big chunk of your hard-earned cash stuck in excess inventory.
But don’t fret; we’re here to help you navigate these tricky scenarios. We’re going to provide you with a comprehensive inventory management analysis. Whether you’re a seasoned Amazon seller looking to fine-tune your strategies or a newcomer eager to learn the ropes, this is your roadmap to success.
Understanding the Inventory Management Calculator
Rick’s inventory management calculator is a comprehensive tool that streamlines the decision-making process when it comes to your Amazon inventory. While the spreadsheet may seem a bit overwhelming at first, it’s actually quite straightforward.

Right off the bat, you’ll see the color-coded columns:
- Yellow Columns (User Input): These are the fields that require your input. You’ll fill in information and the calculator will do its work in the orange fields.
- Orange Columns (Calculated Fields): These columns are where the magic happens. They automatically calculate values based on the data you’ve provided in the yellow columns.
Here’s a breakdown of those yellow columns:
- Days of Stock – This represents the number of days of inventory you want to keep in stock. It’s a critical factor in determining how much inventory you should have on hand.
- Production Time – This is the time it takes for your supplier to produce your goods. It typically ranges from 20 to 30 days.
- Shipping Time – Shipping time indicates how long it takes for your products to reach Amazon’s fulfillment center. The method of shipping (e.g., sea, air, or freight) affects this time frame.
- Safety Stock – Safety stock is a buffer to account for unexpected delays, increased demand, or other unforeseen issues. Rick recommends setting it at around 30% of your target days of stock.
- Current and Inbound Stock – These fields represent your current inventory levels and any incoming shipments that are en route to Amazon’s warehouse.
Using the Calculator
The accuracy of your inputs is paramount. The calculator can only work its magic if you feed it the right data. So, take your time, double-check those numbers, and ensure they reflect the reality of your business.
Once you’ve entered all these values into the calculator, it will provide you with essential information to make informed decisions about your inventory.
Gathering Information for Analysis
Before you can use the Inventory Management Calculator, you’ve got to get the right data to plug into the spreadsheet.
Current Inventory and Inbound Shipment Data
These are the lifeblood of your inventory analysis. You need to know what you’ve got in stock and what’s en route to Amazon’s FBA centers.
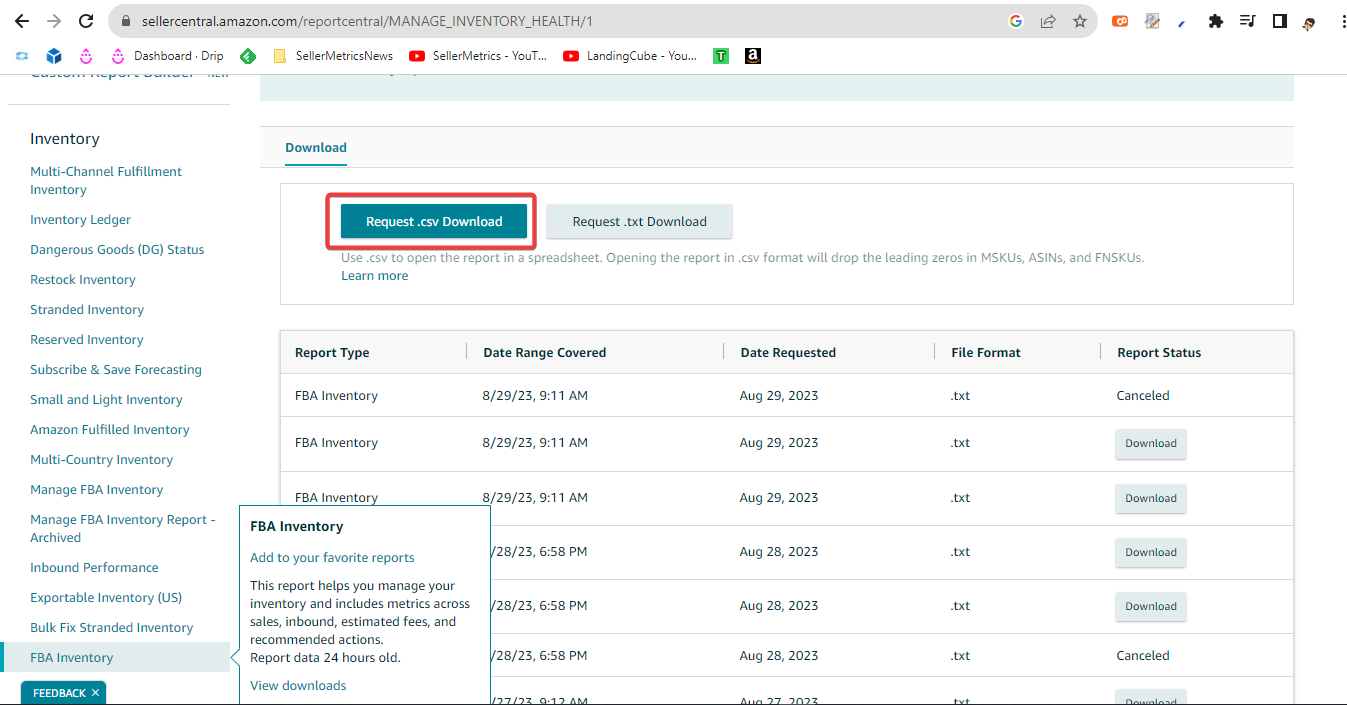
Find this data by heading over to your Amazon Seller Central dashboard. Click the hamburger (3 lines) menu in the top left corner and select Reports. Click Fulfillment. Under the Inventory heading in the left navigation, click FBA Inventory. Download the report.
Practical Inventory Analysis
To give you a clear picture of how this all comes together, we’ll walk you through an example using a sample product. Let’s break it down step by step:
Step 1: Choose Your Product
Let’s say we’re analyzing a product. I just chose a random one from the report I downloaded. We’ll call it “Product X.” Currently, we have 644 units of Product X available for sale.
Step 2: Gather the Data
Before we get started, we’ll need some key data points.
For Days of Stock, decide how many days of stock you want to maintain. In our case, let’s go with 30 days.
For Production Time, typically, it takes around 25 days for our supplier to manufacture Product X.
For Shipping Time, we’ll estimate a shipping time of 30 days since we’re air shipping.
RANK LIKE THE PROS
Discover a better way to rank products from external traffic, like Facebook, Google and TikTok, with LandingCube promo pages.
Try it free for 21 days.
Finally, for Safety Stock, let’s stay on the safe side with 30% of our target days of stock, which is roughly 80 units.
Step 3: Sales Velocity
Determine the sales velocity for Product X. Let’s assume it’s 300 units per month.
Step 4: Input the Data
Plug in these values into the yellow columns of your inventory management calculator.
Step 5: Analyze the Results
Now, let’s take a closer look at the orange columns and see what they reveal:
- Reorder Point – This is the level at which we should reorder. It’s calculated by adding your production time, shipping time, and safety stock to your days of stock. In our case, it’s at 725 units.
- Days Until Next Order – This tells us how many days we have left before we need to place another order. In our case, it’s telling us that we should’ve placed an order five days ago!
- Units to Order – This is the magic number. It tells us how many units of Product X we should reorder. To calculate it, we subtract our current stock (644 units) and our inbound stock (if any) and then add back our safety stock. In our case, it’s 446 units.
Step 6: Interpret and Take Action
So, what do these numbers tell us?
They’re telling us that, with our current stock and sales velocity, we should’ve reordered Product X five days ago. If we don’t act soon, we risk running out of stock.
The reorder point (725 units) is a critical threshold. If our stock dips below this number, it’s a signal to reorder immediately. In our case, we’re below that point, so we need to act fast.
The magic number (446 units) is the quantity we should reorder to ensure we have enough stock to meet demand, accounting for safety and shipping times.
And there you have it – a practical inventory analysis in action!
Making Informed Inventory Decisions
Now that we dove into the practical side of inventory analysis, it’s time to take a closer look at the heartbeat of the whole process – the reorder point.
This number is your guide when it comes to making informed inventory decisions. Let’s break it down:
Understanding the Formulas
The data in the orange columns is generated by a few formulas. If you like to break down the numbers like I do, then you’ll appreciate a deeper understanding on these formulas.
The Reorder Point Formula
The reorder point is your inventory’s red alert system. It’s that critical threshold that, when crossed, signals that it’s time to make a move and reorder more stock.
In other words, it’s the level at which you should trigger a new order to ensure you don’t run out of products.
So, how do you calculate this all-important reorder point?
It’s not as complex as it might seem. The formula is your trusty tool:
Reorder Point = ((Production Time + Shipping Time) x Daily Sales Velocity) + Safety Stock
Breaking Down the Formula
Let’s dissect this formula step by step using our example for Product X:
Days of Stock – This is the number of days you’ve decided to keep in stock, which we set at 30 days in our example.
Production Time – This is how long it takes for your supplier to manufacture or prepare your product. We estimated it at 25 days.
RANK LIKE THE PROS
Discover a better way to rank products from external traffic, like Facebook, Google and TikTok, with LandingCube promo pages.
Try it free for 21 days.
Shipping Time – The time it takes for your product to journey from your supplier to Amazon’s FBA centers, set at 30 days for air shipping.
Daily Sales Velocity – This is how many units of your product you sell in a day, which we assumed to be 10 units per day.
Safety Stock – Your safety net for unexpected delays or surges in demand, which we calculated as 80 units.
So, the math would look like this:
Reorder Point = (( 25 days + 30 days) x 10 units per day) + 80 units
Days Until Next Order Formula
This formula is designed to quickly tell me whether or not I need to make a stock order or not.
It looks like this:
Days Until Next Order = (Current – Reorder Point) / Daily Sales Velocity
– or using our example:
Days Until Next Order = (644-725) / 24
Units to Order Formula
All of this data isn’t much good if it’s not informing you how to solve the inventory problem, right?
Once you’ve figured out your reorder point, you’re probably wondering, “How many units should I reorder?” This is where things get interesting.
The optimal quantity to order is essentially how much product you need to bring your inventory back up to your desired days of stock. You don’t want to overdo it, as that ties up cash and storage space, but you certainly don’t want to run out of stock either.

The formula looks like this:
Units to Order = ((DoS + Production Time + Shipping Time) x Daily Sales Velocity) + Safety Stock – Current – Inbound
– or without example numbers plugged in:
Units to order = ((30 + 25 + 30) x 25) + 80 – 644 – 85
In our example, we found that we needed to reorder 446 units of Product X. This means that, based on our calculations and inventory levels, it’s time to get in touch with our supplier and place that order.
By understanding the reorder point and using the formula to calculate it, you’re arming yourself with the knowledge needed to make precise and informed inventory decisions.
No more guessing games, no more stockouts, and no more overstocking. It’s all about maintaining that delicate balance in your Amazon business, and with this tool, you’re well on your way to mastering the art of inventory management.
Accessing the Inventory Management Spreadsheet
The inventory management spreadsheet we’ve been talking about is at your fingertips, ready to empower your inventory management journey. Here’s how you can get your hands on this valuable tool:
Downloading the Spreadsheet:
- Click here to grab it – https://go.landingcube.com/V98
Steps to Download:
- Once you’re on the download page, I’ll ask you to share your email address and name. Your information will never be shared or sold. Fill out the form and click the button. The spreadsheet will be on its way to your inbox.
Why You Should Use the Tool:
Now, you might be wondering, “Why should I bother with this spreadsheet?” Well, let me tell you – it’s a game-changer for your Amazon business. Here’s why:
- Saves Time: No more manual calculations or guesswork. This tool does the heavy lifting for you, allowing you to focus on growing your business.
- Precision: It ensures accuracy in your inventory management, reducing the risk of stock-outs or overstocking.
- Adaptability: You can tailor the spreadsheet to your specific needs and adjust variables as your business evolves.
- Informed Decisions: It provides clear insights into when to reorder and how much to order, making your inventory decisions more informed and strategic.
So, don’t hesitate – grab that download link, explore the tool, and take your Amazon business to new heights.
Additional Resources and Community
As you dive deeper into the world of Amazon FBA and inventory management, I want to ensure you have a wealth of resources and a supportive community to lean on. Here are some valuable assets that can help you on your journey:
1. Join Our Facebook Groups: Rick Wong, the mastermind behind the inventory management calculator, hosts not one, but two vibrant Facebook groups dedicated to Amazon FBA discussions. These groups are a goldmine for knowledge sharing, networking, and problem-solving. Whether you’re a seasoned pro or just starting out, you’ll find valuable insights and connections in these communities.
- Amazon FBA Brand Building Group – Dive into discussions on building your brand, scaling your business, and navigating the intricacies of Amazon selling. Join this group here.
- Amazon PPC Group – If you’re looking to supercharge your Amazon advertising game, this group is the place to be. Explore strategies, tips, and best practices for optimizing your PPC campaigns. Join this group here.
2. Explore Landing Cube: If you’re keen on expanding your Amazon business beyond the platform and building a brand that thrives off Amazon, Landing Cube is a tool you’ll want in your toolkit. It’s a landing page builder designed specifically for off-Amazon marketing needs. Whether you’re running Google, Facebook, TikTok ads, or creating product inserts, Landing Cube streamlines the process and helps you collect valuable customer data.
Get Started with a 21-Day Free Trial: To kickstart your off-Amazon marketing journey, we’re offering you a 21-day free trial of Landing Cube. It’s the perfect opportunity to test drive this powerful tool and see how it can elevate your brand-building efforts. Simply click on this link to access your free trial: Landing Cube 21-Day Free Trial.
Parting Thoughts
Inventory management is a fundamental skill for Amazon sellers. By utilizing tools like Rick Wong’s inventory management calculator, you can optimize your stock levels, reduce storage costs, and ensure you never miss out on sales due to being out of stock. It’s a valuable tool for scaling your Amazon business and staying ahead of the competition.
With the right strategies and tools in place, you can thrive as an Amazon seller and navigate the intricacies of inventory management successfully. Happy selling!
RANK LIKE THE PROS
Discover a better way to rank products from external traffic, like Facebook, Google and TikTok, with LandingCube promo pages.
Try it free for 21 days.


