Jun 28th 2026
Resources
- Facebook Ads for Amazon [Video Course]
- Drive Traffic To Amazon [Ultimate Guide]
- Get More Amazon Reviews [Ultimate Guide]
TL;DR
Will Amazon ads keep getting more expensive?
Almost certainly. Ad revenue is growing 22–24% a year and average cost-per-click has climbed from ~$0.71 to ~$1.00–$1.12. Win on efficiency (tighter targeting and higher-converting listings) not just a bigger budget.
Do I really need FBA and Prime to compete?
Effectively, yes. About 82% of active sellers use FBA, and Prime-eligible listings convert far better. Build the FBA and storage fees into your price; the conversion lift almost always pays for them.
How much does the average Amazon shopper actually spend?
A lot, if they’re Prime: members spend $1,000–$1,400 a year versus about $570 for non-members. Winning repeat Prime buyers is worth far more than chasing one-time bargain hunters.
When are Amazon’s biggest sales days in 2026?
Amazon moved Prime Day to June this year, earlier than usual, joining Black Friday/Cyber Monday and December as the heaviest days. Plan inventory months ahead and protect margins instead of slashing your best sellers.
How much does Amazon make a day? In 2026, Amazon makes about $2 billion per day — roughly $84.8 million an hour, $1.41 million a minute, and about $23,500 every second. That’s based on a trailing-twelve-month revenue pace of about $742.7 billion through Q1 2026, up from full-year 2025 net sales of $716.9 billion.
| Time period | Revenue (2026 run-rate)* | Net profit (FY2025 basis)** |
|---|---|---|
| Per second | ~$23,500 | ~$2,460 |
| Per minute | ~$1.41 million | ~$148,000 |
| Per hour | ~$84.8 million | ~$8.9 million |
| Per day | ~$2.0 billion | ~$212.8 million |
| Per year | $716.9B (FY2025) | $77.7B (FY2025) |

*Run-rate = trailing twelve months through Q1 2026 (reported April 2026), divided across the year. **Profit is lumpy and doesn’t track revenue evenly; we anchor it to Amazon’s full-year 2025 net income because Q1 2026 net income was inflated by a one-time gain.
Table of Contents
- Where Amazon’s Money Actually Comes From (2025 Revenue by Segment)
- Revenue vs. Profit: The Number Most Sellers Get Wrong
- How Much Does Amazon Make a Year? (2019–2026)
- Prime Day and Amazon’s Most Profitable Days
- How Much Do Amazon Sellers Make a Day?
- What These Numbers Mean for Your Amazon Business
- Why Different Sources Report Different Numbers
- How Many Products Does Amazon Sell?
- How Many Orders (and Packages) Does Amazon Ship a Day
- How Many Sellers Are on Amazon?
- How Many Customers Are on Amazon?
- Amazon Statistics
- Amazon Customer Statistics
- Amazon Seller Statistics
- Amazon Advertising Statistics
- In Summary
- Sources/References
- FAQ: All About Amazon Statistics
If you’ve ever watched a Prime van roll down your street and wondered how one company moves that much money, you’re not alone. But for Amazon sellers, this number is more than a fun fact. The way Amazon earns ( which segments grow, which ones actually turn a profit, and where the cash comes from) is a roadmap that tells you where the platform is heading and where your brand fits into it.
Below, we break down exactly how much Amazon makes a day, where that money comes from, how much of it is real profit, and what every one of these numbers means for third-party sellers trying to scale.
Where Amazon’s Money Actually Comes From (2025 Revenue by Segment)
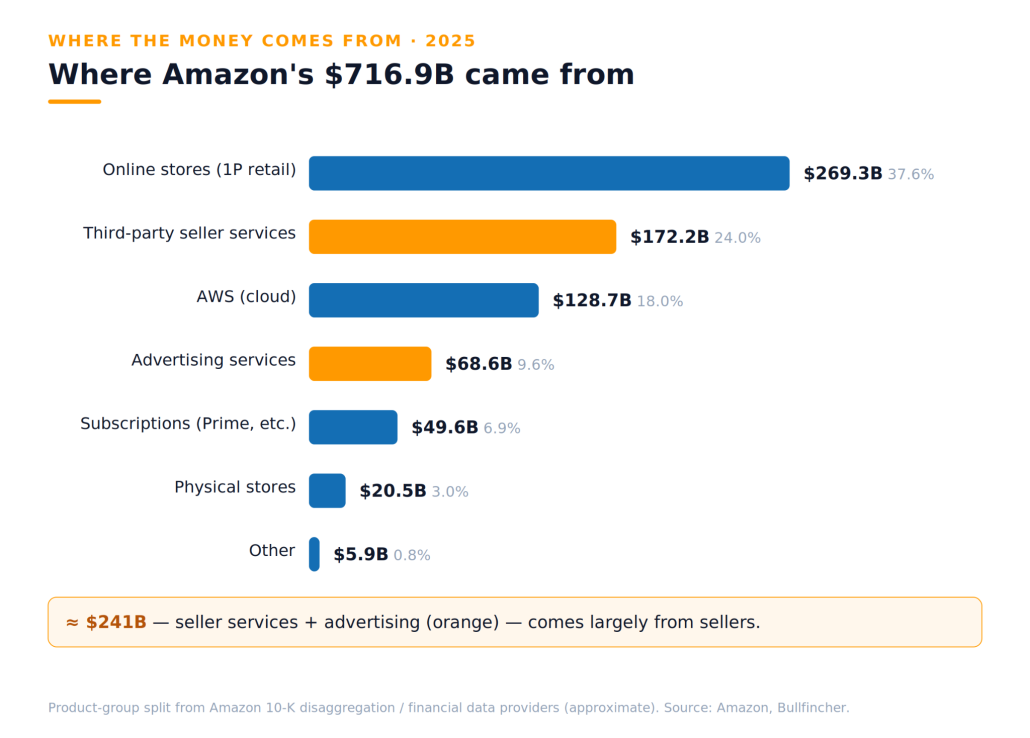
Saying “Amazon makes $2 billion a day” hides the most useful part of the story. Amazon is no longer just a store. It’s a logistics company, a cloud provider, and one of the largest advertising platforms on earth, all stacked into one income statement. Here’s how the $716.9 billion broke down in 2025:
| Segment | 2025 revenue | Share of total | What it is |
|---|---|---|---|
| Online stores (1P retail) | $269.3B | ~37.6% | Products Amazon sells itself |
| Third-party seller services | $172.2B | ~24.0% | Commissions, FBA & shipping fees you pay |
| AWS (cloud) | $128.7B | ~18.0% | Cloud computing for businesses |
| Advertising services | $68.6B | ~9.6% | Sponsored ads sellers and brands buy |
| Subscription services | ~$49.6B | ~6.9% | Prime, Music, Kindle Unlimited, etc. |
| Physical stores | ~$20-21.5B | ~3% | Whole Foods, Amazon Fresh, Go |
| Other | ~$5.9B | ~0.8% | Miscellaneous |
Two lines on this table should grab every seller by the collar.
- First, third-party seller services ($172.2 billion) is now Amazon’s second-largest segment — bigger than AWS. That’s the money Amazon earns from sellers: referral commissions, Fulfillment by Amazon (FBA) fees, and shipping. It grew about 10% year over year, and Q1 2026 alone brought in $41.6 billion. In other words, sellers aren’t a side hustle for Amazon; they’re the engine.
- Second, advertising ($68.6 billion in 2025) is Amazon’s fastest-growing major segment (it grew about 22% in 2025 and 24% in Q1 2026, clearing a $70 billion trailing-twelve-month run-rate by early 2026. Amazon doesn’t buy its own Sponsored Products placements) every dollar of that came from brands and sellers bidding to be seen. Stack advertising on top of seller services and you get roughly $241 billion that Amazon collected, in large part, from the same merchants competing on its shelves. That single fact explains more about your shrinking margins than any fee schedule will.
Revenue vs. Profit: The Number Most Sellers Get Wrong
It’s easy to hear “$2 billion a day” and picture Amazon swimming in cash. The reality is more disciplined and more instructive for your own P&L.
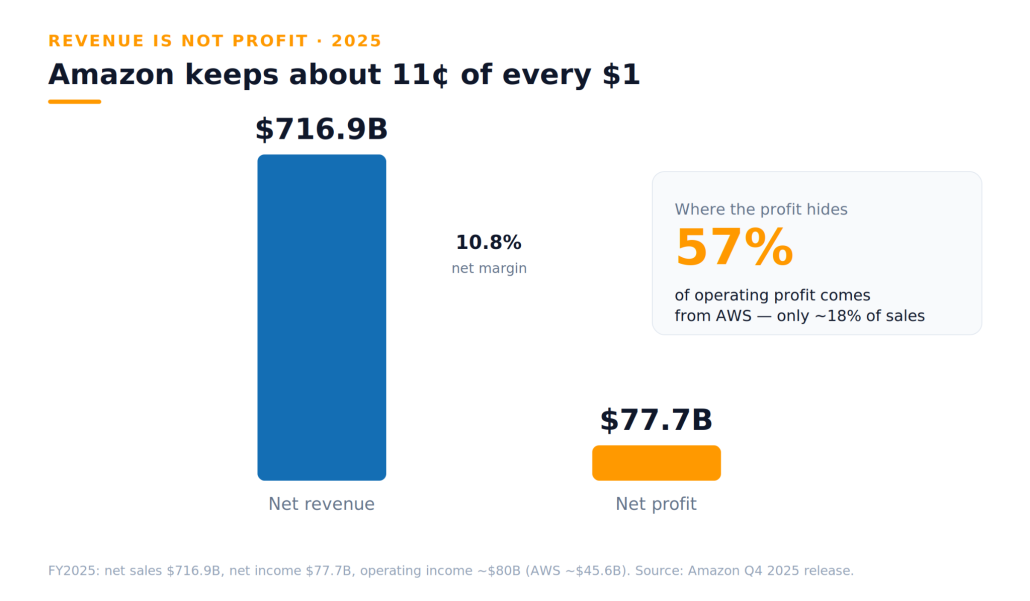
Of that $716.9 billion in 2025 revenue, Amazon kept $77.7 billion in net income, an annual net margin of roughly 10.8%. Spread across the year, that’s about $212.8 million in profit per day; a huge number, but a fraction of the top line. Revenue is the size of the river; profit is how much water you actually keep.
The more important lesson is where that profit comes from. Amazon’s total operating income in 2025 was about $80 billion and AWS alone contributed roughly $45.6 billion of it, about 57%. The cloud business, only ~18% of revenue, produces the majority of operating profit because it runs at far higher margins than retail. (In Q1 2026, AWS posted a ~37.7% operating margin and helped push Amazon’s company-wide operating margin to a record 13.1%.) Online retail, by contrast, runs on thin margins; in many quarters the stores business barely breaks even before advertising and seller fees.
One caution if you read the headlines: Amazon’s Q1 2026 net income of $30.3 billion looked enormous, but about $16.8 billion of it was a one-time accounting gain from its Anthropic investment and not operating profit. Always separate one-time gains from the real business when you benchmark.
Why does this matter to you? Because Amazon uses high-margin cloud and advertising profits to subsidize aggressive pricing and free shipping in retail (the same arena where you compete). You can’t win a price war against a company that funds its retail losses with a $46-billion cloud business. What you can do is borrow Amazon’s playbook: run a segment-level P&L on your own catalog, find the 20% of SKUs that generate 80% of your net profit, and protect those margins ruthlessly instead of chasing revenue for its own sake.
How Much Does Amazon Make a Year? (2019–2026)
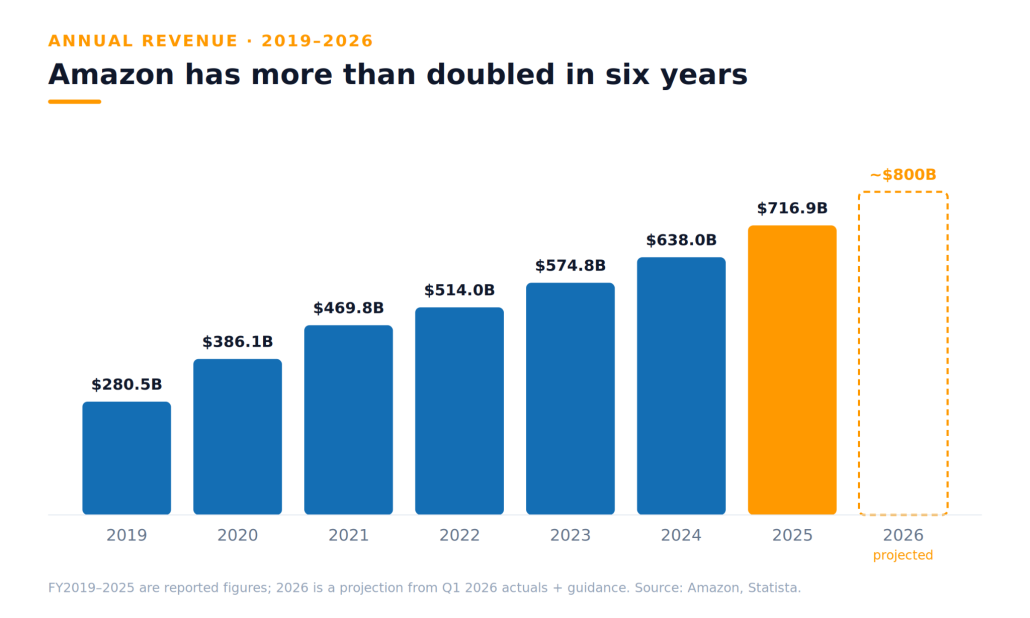
Amazon’s daily revenue only makes sense against its annual trajectory. The company has more than doubled its revenue in six years:
| Year | Net sales | YoY growth |
|---|---|---|
| 2019 | $280.5B | — |
| 2020 | $386.1B | +38% |
| 2021 | $469.8B | +22% |
| 2022 | $514.0B | +9% |
| 2023 | $574.8B | +12% |
| 2024 | $638.0B | +11% |
| 2025 | $716.9B | +12% |
| 2026 (run-rate / projected)* | ~$800B | +~13% |
*Q1 2026 net sales already hit $181.5 billion, up 17% year over year, and Amazon guided Q2 2026 to $194–199 billion. If that pace holds, full-year 2026 should push toward $800 billion — lifting daily revenue past $2.1–2.2 billion a day. Treat the 2026 row as a projection, not a reported figure.
RANK LIKE THE PROS
Discover a better way to rank products from external traffic, like Facebook, Google and TikTok, with LandingCube promo pages.
Try it free for 21 days.
Prime Day and Amazon’s Most Profitable Days
If Amazon averages ~$2 billion on a normal day, its peak shopping events are a different universe. Prime Day 2025 (July 8–11) was Amazon’s biggest ever, and for the first time it ran four days instead of two. Amazon didn’t publish an exact dollar figure, but Adobe Analytics estimated U.S. shoppers spent about $24.1 billion online across all retailers during the four-day window, more than two Black Fridays. The shorter 2024 event was widely estimated at around $14.2 billion.
Worth noting for 2026: Amazon moved Prime Day up to June this year, a month earlier than usual, so the calendar of peak days is shifting. Three windows still reliably produce Amazon’s heaviest days: Prime Day, Black Friday/Cyber Monday, and the run-up to Christmas. For sellers, the takeaway is operational: these are the days when conversion rates spike but so do ad costs and FBA storage fees. Plan inventory months ahead, lock your best ASINs as Prime-eligible, and use these events to clear slow-moving stock before storage fees climb.
How Much Do Amazon Sellers Make a Day?
This is the question behind the question. You probably don’t care how much Jeff Bezos makes, you care how much you can make. Third-party sellers now drive more than 60% of all units sold on Amazon, and there are roughly 1.9 million active third-party sellers worldwide (out of about 9.7 million registered accounts).
Daily earnings vary enormously by catalog size, niche, and model, but the broad picture looks like this:
- New sellers in their first months often make $50–$200 a day while they test products and build reviews.
- Established mid-market brands routinely clear $5,000–$20,000+ a day in revenue.
- The difference is rarely luck. It comes down to product selection, conversion-optimized listings, and disciplined Amazon PPC that keeps customer-acquisition cost under control.
Two structural facts shape every seller’s daily number. About 82% of active sellers use FBA, which raises conversion (Prime eligibility) but adds fulfillment and storage fees. And because advertising is now a ~$70-billion business funded by sellers, rising cost-per-click is a permanent headwind — so the sellers who win treat advertising efficiency as a core metric, not an afterthought.
What These Numbers Mean for Your Amazon Business
Amazon’s financials are a leading indicator for your own strategy. A few signals worth acting on:
- Advertising is going up, not down.
With ad revenue growing ~22–24% a year, expect cost-per-click to keep rising. Build a defensible advertising system now: tight keyword harvesting, dayparting, and creative testing that lifts conversion so you pay less per sale over time. - Amazon is betting ~$200 billion on AI and infrastructure in 2026.
That capital flows into faster delivery, automation, and AI shopping tools like Rufus, which already drove billions in incremental sales. Translation: discovery is shifting toward AI-assisted search. Write listings that answer real buyer questions in natural language, not just keyword-stuffed bullets. - The marketplace is the engine, so Amazon needs you to survive — but it will keep taking its cut.
Seller services plus advertising pull in roughly $241 billion a year. Amazon has every incentive to keep the seller ecosystem healthy and every incentive to raise fees. Protect yourself with margin discipline: know your true net margin after referral fees, FBA, storage, and ads on every SKU, and prune anything that can’t clear a healthy threshold.
Why Different Sources Report Different Numbers
You’ll see Amazon’s daily revenue quoted anywhere from $1.3 billion to $2.2 billion, and the gap isn’t an error, it’s methodology. Some sources use an older year; others divide trailing-twelve-month figures, exclude AWS or advertising, or count only retail. Seasonality matters too: Amazon’s fourth quarter runs far above its first-quarter average, so any annual-divided-by-365 figure is an average, not a literal daily total.
And as the Q1 2026 example shows, even “net income” can mislead when it includes one-time gains. The numbers in this article use Amazon’s official full-year 2025 net sales ($716.9B) as the anchor and a trailing-twelve-month 2026 run-rate (~$742.7B) for the current pace, and we flag every estimate. When you benchmark your own business, always confirm which segments and which period a statistic refers to before drawing conclusions.
How Many Products Does Amazon Sell?
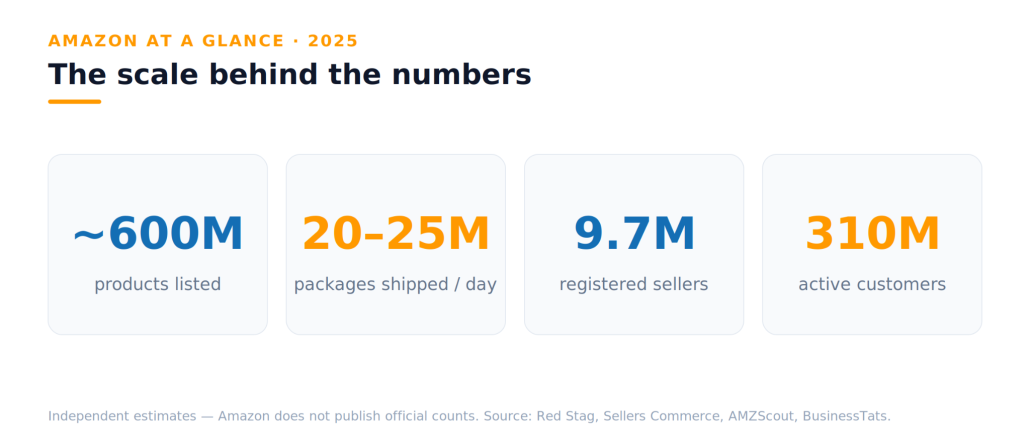
Amazon’s catalog is the largest of any retailer on earth. As of 2024–2025, independent estimates put the total at roughly 600 million products listed worldwide, and more than 588 million of those are listed by third-party sellers rather than Amazon itself.
Amazon doesn’t publish an official number, and it changes daily as listings are added, merged, or purged. For perspective, the catalog sat near 350 million as recently as 2019, it has nearly doubled in six years, driven almost entirely by marketplace sellers. Amazon’s own first-party retail selection is a small slice of that: the “endless shelf” you browse is overwhelmingly other sellers’ inventory.
How Many Orders (and Packages) Does Amazon Ship a Day
Amazon ships an estimated 20–25 million packages per day worldwide in 2025. That works out to roughly 833,000 packages an hour, about 13,800 a minute, and around 231 every second across its global network. To put that scale in perspective, Amazon delivered more than 13 billion items same-day or next-day globally in 2025, over 8 billion of them in the US alone, according to the company’s own figures.
(The “1.6 million packages a day” number still floating around the web is a much older, US-only snapshot; Amazon’s volume is now an order of magnitude larger.) For sellers, the takeaway is simple: the fulfillment machine your FBA fees pay into is staggeringly large, which is exactly why Prime-eligible delivery speed has become table stakes.
How Many Sellers Are on Amazon?
Amazon’s marketplace now hosts more than 9.7 million registered sellers worldwide, of which roughly 2 million are active with live products for sale. About 1.1 million of those active sellers are based in the US, and roughly a million new sellers join every year, around 1.35 million signed up in 2024 alone.
Third-party sellers aren’t a sideshow; they account for more than 60% of all units sold on Amazon, and about 82% of active sellers use Fulfillment by Amazon (FBA) to earn Prime eligibility and the conversion boost that comes with it. If you’re reading this as a seller, you’re part of the single largest engine of growth Amazon has.
How Many Customers Are on Amazon?
Amazon serves an estimated 310 million active customers worldwide, and it remains the most-visited e-commerce site in the US (and one of the four most-visited sites of any kind) pulling in well over 2.7 billion visits a month, more than half from mobile. Its loyalty engine is Amazon Prime. The company stopped disclosing official subscriber counts in 2021, but third-party research puts membership at roughly 200 million in the US and around 240 million worldwide as of late 2025.
RANK LIKE THE PROS
Discover a better way to rank products from external traffic, like Facebook, Google and TikTok, with LandingCube promo pages.
Try it free for 21 days.
Prime is worth the cost to Amazon many times over: members spend well over $1,000 a year on average (estimates range from about $1,170 to $1,400) more than double the roughly $570 a typical non-member spends. That spending gap is why Amazon invests so heavily in fast, free delivery, and why Prime-eligible listings convert so much better for sellers.
Amazon Statistics
- Amazon generated $716.9 billion in net revenue in 2025, up 12% from $638 billion in 2024; spanning online retail, third-party seller services, AWS, advertising, and subscriptions. (Source: Amazon Q4 2025 earnings release)
- Amazon’s own first-party retail (online stores) brought in about $269.3 billion in 2025. (Source: Bullfincher)
- Third-party seller services (commissions, FBA, and shipping) totaled about $172.2 billion in 2025, now Amazon’s second-largest segment, bigger than AWS. (Source: Bullfincher)
- AWS generated $128.7 billion in 2025 (+20%) and roughly $45.6 billion in operating income — about 57% of Amazon’s total operating profit. (Source: Amazon Q4 2025 earnings release)
- Amazon spent an estimated $98.5 billion on fulfillment in 2024. (Source: Capital One Shopping)
- Amazon ships an estimated 20–25 million packages a day worldwide. (Source: Sellers Commerce)
- Amazon lists roughly 600 million products worldwide. (Source: Red Stag Fulfillment)
- Amazon holds nearly 40% of the US e-commerce market and is the #1 online retailer in the country. (Source: G2)
- Amazon’s market value sits around $2.5–2.6 trillion as of 2025–2026. (Source: GrabOn)
- Prime Day 2025 drove an estimated $24.1 billion in US online spending across retailers — Amazon’s biggest event ever. (Source: Digital Commerce 360 / Adobe)
Amazon Customer Statistics
- Amazon has an estimated 310 million active customers worldwide. (Source: BusinessTats / Yaguara)
- Amazon attracts more than 2.7 billion visits a month, over half from mobile devices. (Source: AMZScout)
- There are an estimated 200 million Prime members in the US and ~240 million worldwide (2025). (Source: Capital One Shopping / BusinessTats)
- About 75% of US Amazon shoppers are Prime members. (Source: Capital One Shopping)
- Prime members spend well over $1,000 a year on average — more than double the ~$570 spent by non-members. (Source: Capital One Shopping)
- The median Prime member places about four orders a month. (Source: Sci-Tech-Today)
- Fast, free shipping remains the #1 reason people shop on Amazon, ahead of selection and price. (Source: widely cited consumer surveys)
- Most shoppers still begin product searches on Amazon rather than a general search engine. (Source: widely cited consumer surveys)
Amazon Seller Statistics
- There are more than 9.7 million registered sellers worldwide, with roughly 2 million active. (Source: AMZScout)
- About 1.1 million active sellers are based in the US — the single largest seller country. (Source: Red Stag / Statista)
- Roughly 1.35 million new sellers joined in 2024 (about a million per year). (Source: AMZScout)
- Third-party sellers account for more than 60% of all units sold on Amazon. (Source: Bullfincher / Amazon)
- About 82% of active sellers use FBA. (Source: eDesk)
- Over 10,000 independent sellers surpassed $1 million in sales for the first time in 2023. (Source: G2)
- FBA (Prime-eligible) listings typically convert meaningfully better than non-Prime listings, which is a major reason FBA adoption keeps climbing. (Source: industry seller surveys)
Amazon Advertising Statistics
- Amazon’s advertising business generated about $68.6 billion in 2025 (up ~22%), clearing a $70 billion trailing-twelve-month run-rate by early 2026 — and nearly all of it comes from sellers and brands. (Source: Bullfincher / Amazon)
- Amazon is the third-largest digital advertising platform in the US, behind only Google and Meta. (Source: Marketplace Pulse)
- The average cost per click is around $1.00–$1.12 in 2025, up from roughly $0.71 a few years ago. (Source: Ad Badger / Sequence Commerce)
- The average click-through rate is about 0.35%–0.5% — low by display standards, but the clicks carry high purchase intent. (Source: Trellis / Sequence Commerce)
- The average conversion rate on Amazon ads is roughly 10% — far above the ~1–2% typical of other channels. (Source: Sequence Commerce / bidx)
- Sponsored Products remain the dominant ad format by spend, ahead of Sponsored Brands and Sponsored Display. (Source: industry benchmarks)
- The typical ACoS (advertising cost of sales) runs around 30%, though profitable sellers often target 15–25%. (Source: atom11 / Autron)
In Summary
Put it all together and the picture is clear: Amazon is one of the largest companies on earth, generating roughly $2 billion in revenue a day, and it shows no sign of slowing down. For the more than 9.7 million sellers on its marketplace, that scale cuts both ways. On one side, you get access to hundreds of millions of ready-to-buy customers and the instant trust that comes with the Amazon name. On the other, the same numbers reveal exactly where Amazon takes its cut — through seller fees and a fast-growing advertising business that together pull in well over $240 billion a year, much of it from sellers like you.
The sellers who thrive in 2026 aren’t the ones chasing Amazon’s headline growth. They’re the ones who treat their Amazon presence like a real business: watching true margins after every fee, keeping advertising efficient as click costs rise, and building a brand customers come back to. Use these numbers not as trivia, but as a map of where the platform makes its money; and plan your business around the same logic Amazon uses for its own.
Sources/References
Primary sources (strongest):
- Amazon — Q1 2026 Earnings Release (Apr 29, 2026): https://www.aboutamazon.com/news/company-news/amazon-earnings-q1-2026-report
- SEC — Amazon 8-K, Q1 2026 results: https://www.sec.gov/Archives/edgar/data/0001018724/000101872426000012/amzn-20260331xex991.htm
- Amazon — Q4 & Full-Year 2025 Earnings Release (Feb 5, 2026): https://ir.aboutamazon.com/news-release/news-release-details/2026/Amazon-com-Announces-Fourth-Quarter-Results/
- Amazon — 2025 Annual Report (Form 10-K): https://s2.q4cdn.com/299287126/files/doc_financials/2026/ar/Amazon-2025-Annual-Report.pdf
- Amazon — Prime Day 2025 Recap: https://www.aboutamazon.com/news/retail/prime-day-2025-recap
Supporting sources (segments, history, context):
- Bullfincher — Amazon Revenue by Segment 2025: https://bullfincher.io/companies/amazoncom/revenue-by-segment
- Statista — Amazon annual revenue 2005–2025: https://www.statista.com/statistics/266282/annual-net-revenue-of-amazoncom/
- Statista — Amazon net revenue by product group (quarterly): https://www.statista.com/statistics/999686/amazons-net-revenue-by-product-group-quarter/
- Business of Apps — Amazon Statistics 2026 (Prime members, ad revenue): https://www.businessofapps.com/data/amazon-statistics/
- CNBC — Amazon Q1 2026 earnings report: https://www.cnbc.com/2026/04/29/amazon-amzn-q1-earnings-report-2026.html
- Variety — Amazon Q1 2026 segment breakdown: https://variety.com/2026/digital/news/amazon-earnings-q1-181-billion-1236733307/
- TIKR — Amazon Q1 2026 (record margin, Anthropic one-time gain): https://www.tikr.com/blog/amazon-q1-2026-beat-hides-its-most-exciting-new-revenue-engine
Prime Day, packages & seller data:
- Digital Commerce 360 — Prime Day 2025 ($24.1B Adobe): https://www.digitalcommerce360.com/article/amazon-prime-day-sales/
- ROI Revolution — Prime Day 2025 recap (2024 ~$14.2B): https://roirevolution.com/blog/amazon-prime-day-recap-2025/
- Red Stag Fulfillment — Active third-party sellers 2025 (~1.9M active / 9.7M registered): https://redstagfulfillment.com/how-many-third-party-sellers-are-on-amazon/
- Sellers Commerce — Package delivery statistics 2026 (~20–25M packages/day): https://www.sellerscommerce.com/blog/package-delivery-statistics/
- eDesk — Amazon Statistics 2026 (82% use FBA): https://www.edesk.com/blog/amazon-statistics/
- GrabOn — Amazon Statistics 2026 (valuation ~$2.58T): https://grabon.com/blog/amazon-statistics/
Scale & logistics
- Red Stag Fulfillment — How Many Products Does Amazon Carry (2025): https://redstagfulfillment.com/how-many-products-does-amazon-carry/
- Red Stag Fulfillment — How Many Items Does Amazon Ship Per Day (2025): https://redstagfulfillment.com/how-many-items-does-amazon-ship-per-day/
- Amazon — 13 billion items same/next-day in 2025 (official): https://www.aboutamazon.com/news/retail/amazon-prime-same-day-next-day-delivery-2025
- Capital One Shopping — Amazon Logistics Statistics (2026): https://capitaloneshopping.com/research/amazon-logistics-statistics/
Customers & Prime
- Capital One Shopping — Amazon Prime Statistics (2026): https://capitaloneshopping.com/research/amazon-prime-statistics/
- BusinessTats — Amazon Prime overview (240M ww / 200M US): https://businesstats.com/amazon-prime-topic-overview/
- AMZScout — Amazon Statistics (2026) (sellers, customers, visits, FBA): https://amzscout.net/blog/amazon-statistics/
Market share & sellers
- G2 — Amazon Statistics (US e-commerce share, $1M sellers): https://learn.g2.com/amazon-statistics
Advertising benchmarks
- Ad Badger — Amazon Advertising Benchmarks (2026) (CPC/CTR): https://www.adbadger.com/blog/amazon-advertising-stats/
- Sequence Commerce — Amazon Advertising Statistics (2026) (CPC $1.12, conv ~10%): https://sequencecommerce.com/amazon-advertising-statistics/
- Trellis — Amazon Ads Benchmarks (2026) (CTR/conversion ranges): https://gotrellis.com/resources/blog/amazon-advertising-benchmarks/
FAQ: All About Amazon Statistics
In 2026, Amazon makes about $2 billion a day, based on a trailing-twelve-month revenue pace of roughly $742.7 billion through Q1 2026. Using its last full year (2025 net sales of $716.9 billion), the figure is ~$1.96 billion a day, about $84.8 million an hour, $1.41 million a minute, and around $23,500 every second.
Amazon’s net income in 2025 was $77.7 billion, which averages to roughly $212.8 million in profit per day. That’s far below its ~$2 billion in daily revenue because retail runs on thin margins; most of Amazon’s profit comes from AWS and advertising.
About $23,500 per second in revenue at the 2026 run-rate, and an estimated $2,460 per second in net profit (based on 2025 full-year figures).
Amazon reported $716.9 billion in net sales for full-year 2025, up about 12% from $638 billion in 2024. Q1 2026 alone hit $181.5 billion (up 17%), and analysts expect full-year 2026 to approach $800 billion.
Amazon Web Services (AWS). Though AWS is only about 18% of revenue, it generated roughly $45.6 billion of Amazon’s ~$80 billion operating income, about 57% of total operating profit in 2025 because it runs at far higher margins than retail. In Q1 2026, AWS posted an operating margin near 37.7%.
Online stores (first-party retail) are the largest single segment at $269.3 billion in 2025. But third-party seller services ($172.2 billion) plus advertising ($68.6 billion) together exceed it and most of that money comes directly from sellers.
Amazon doesn’t release an exact figure, but Prime Day 2025 (July 8–11) was its biggest ever. Adobe estimated U.S. shoppers spent about $24.1 billion online across all retailers during the four-day event, more than two Black Fridays. For 2026, Amazon moved Prime Day to June.
It varies widely. New sellers often make $50–$200 a day, while established mid-market brands routinely clear $5,000–$20,000+ a day. Third-party sellers account for more than 60% of all units sold on Amazon.
Amazon doesn’t disclose exact figures, but independent estimates put global shipments at roughly 20–25 million packages a day. In 2025, there’s about 231 packages every second across its network.
Generally no, shipping and fulfillment run close to or below cost. Amazon treats fast, free delivery as a way to win loyalty, subsidizing it with Prime fees and high-margin segments like AWS and advertising.
Yes, for brands that manage it like a real business. Success now depends on disciplined inventory management, conversion-optimized listings, and efficient PPC to control rising advertising costs, not just listing a product and waiting.
RANK LIKE THE PROS
Discover a better way to rank products from external traffic, like Facebook, Google and TikTok, with LandingCube promo pages.
Try it free for 21 days.